Playbook of Solutions

Home
About
Policy Measures
De-risking Tools
Finance Mechanisms
Case Studies
Get Involved

Case Studies

The Playbook of Solutions is an interactive online tool, referencing concrete, already implemented policy measures, de-risking tools and finance mechanisms that have successfully helped unlock finance for clean energy in the Global South. 

Challenges to InvestmentIn the early 2000s, Chile’s development of non-conventional renewable energy (NCRE) sources – solar, geothermal, biomass, wind, small-scale hydro, and biomass/biogas – was limited, representing a low share of electricity production despite significant natural potential. At that time, large-scale NCRE investment projects faced challenges, particularly high costs and market concentration among a relatively small number of large players. The country lacked a comprehensive incentive structure to help drive down NCRE investment costs. The existing transmission infrastructure was also insufficient to integrate NCRE sources, which are often location-specific (e.g. hydro power must be located near bodies of water). Chile required significant policy interventions to address these challenges and to lower entry barriers for small and new players in the NCRE space.Approach In 2010, Law No. 20.257 came into force in Chile, introducing a quota obligating an explicit amount of electricity generation from NCRE sources. Per the new law, electricity companies generating more than 200 MW were mandated to supply 5% of their marketed energy from NCRE sources over the period 2010-2014. This quota would increase further by an annual rate of 0.5 percentage points after 2015, with a view to reach 10% of supply by 2024. According to the law, NCRE sources were defined as solar, wind, bioenergy, biomass, geothermal, mini-hydro, and tidal. Electricity companies who failed to comply with the law would be subject to a tax for each MWh of deficit versus the quota obligation. Any electricity company exceeding its NCRE obligation could transfer its surplus to another electricity company. On 14 October 2013, Law No. 20.698 increased the quota goal from 10% by 2024 to 20% by 2025. If the overall NCRE deployment target wasn’t met, the Ministry of Energy would be required to offer public tenders to allocate the remaining NCRE capacity.  Key Enabling Conditions The Ministry of Energy emphasized the development of NCRE as a key aspect of the National Energy Strategy 2012-2030 for Chile. This commitment demonstrated the credibility and long-term intention of the government and instilled confidence in investors. The establishment of the Ministry of Energy in 2010 further reflected Chile’s dedication to promote NCRE, and created a clear penalty system when the quota was not met. Additionally, investors and stakeholders’ awareness of the geographic potential for renewable energy sources in Chile supported the development and utilization of NCRE. Impact / OutcomesChile’s quota policy helped to open the market for NCRE, mandating NCRE installation, fostering greater competition and sending price signals that incentivized investment into NCRE technologies. Although the policy also included penalties where the quota was not met, NCRE generation has consistently exceeded the annual quota target, expanding rapidly after the law’s implementation. In 2017, seven years after the law’s implementation, NCRE capacity exceeded the quota of 3,642 GWh by more than three times, reaching 11,087 GWh. By 2020, NCRE accounted for 23.4% of total generation, surpassing the 20% target set for 2025 five years ahead of schedule. Additional SourcesIRENA (2015), Renewable Energy Policy Brief: Chile; IRENA, Abu Dhabi, https://www.irena.org/-/media/Files/IRENA/Agency/Publication/2015/IRENA_RE_Latin_America_Policies/IRENA_RE_Latin_America_Policies_2015_Country_Chile.pdf?la=en&hash=304E17839F669D9E62CD40C68391A31364F97892 Ministry of Energy / GIZ Chile (2018), Non-Conventional Renewable Energies in the Chilean Electricity Market, https://www.acera.cl/wp-content/uploads/2019/08/2018-Las-ERNC-en-el-Sistema-Ele%CC%81ctrico-Chileno-ingle%CC%81s.pdf Ministry of Energy (2012), Estrategia Nacional de Energía 2012-2030, https://cdn.climatepolicyradar.org/navigator/CHL/2008/national-energy-strategy-2012-2030_60b1e85645ccbe3ef86808c37b11780a.pdf Nasirov S, Silva C, Agostini CA. Investors’ Perspectives on Barriers to the Deployment of Renewable Energy Sources in Chile. Energies. 2015; 8(5):3794-3814. https://doi.org/10.3390/en8053794 Renewable Energy Center (2012), Chile: Development & opportunities of the Solar Energy Market https://www.rifs-potsdam.de/sites/default/files/files/13-repla_potsdam_-2012-10-02-chile.pdf Serra, P. (2022). Chile's electricity markets: Four decades on from their original design. Energy Strategy Reviews, 39, 100798, https://www.sciencedirect.com/science/article/pii/S2211467X21001814 https://bcn.cl/2epdk https://www.bizlatinhub.com/chile-renewable-energy-paradise/ https://climateactiontracker.org/countries/chile/policies-action/ https://climate-laws.org/document/law-no-20-257-on-non-conventional-renewable-energies_0bc5 https://climatepolicydatabase.org/policies/law-no-20257-non-conventional-renewable-energies-chile-2008 https://www.iea.org/policies/4853-non-conventional-renewable-energy-law-law-20257 https://jia.sipa.columbia.edu/news/renewable-energy-chile-barriers-and-role-public-policy
Chile
Technology Standards/Quota System
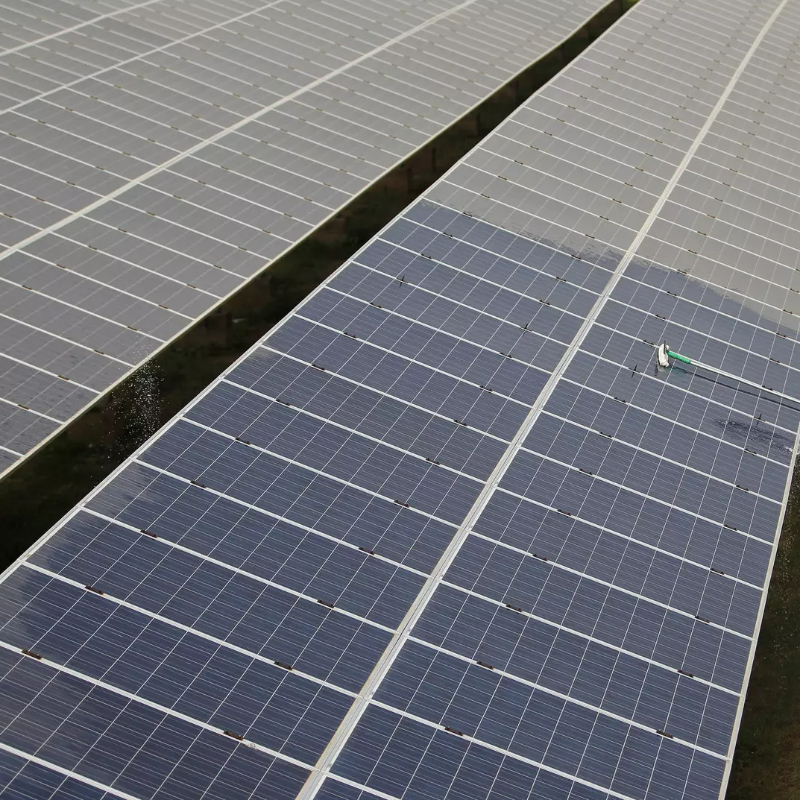
Challenges to InvestmentIn 2009, roughly 400 million people and 28 million households lacked access to electricity, especially in rural areas. The Ministry of Power aimed to give them all access to electricity. Off-grid solutions offered a complementary tool to general grid connection to accelerate electrification. However, it faced some challenges establishing a financial strategy to defray the high upfront costs of solar energy and overcoming the lack of technical expertise in remote areas. India also faced challenges in developing a domestic market for solar, as there was limited awareness about solar technology and financing was not widely available to support solar adoption. Additionally, regulatory complexities and inconsistent policies across different states slowed down solar deployment. ApproachIn order to address one of the several challenges, in 2010, the government launched the National Solar Mission setting up targets for grid-connected PV (Phase I & II) and off-grid solar PV (Phase II & III) and implementing right policy conditions (e.g., permitting foreign direct investment, notification of standards for deployment of solar equipment, standard bidding guidelines). In 2016, the Atal Jyoti Yojana for the installation of solar street lightning system was launched along with a scheme to distribute Solar Study lamps. In 2018, the Ministry of New and Renewable Energy (MNRE) extended capital grant support for Concentrated Solar Thermal (CST) applications until 2020. For the 2018-2019 fiscal year, the subsidy was set at 30% of the benchmark or actual investment cost (whichever was lower). This subsidy was reduced to 20% in the program's final year. States in special categories received subsidies between 60% and 40% of capital costs. The MNRE allocated USD 0.98 million (INR 70 million) to the program. In 2019, the PM-KUSUM scheme was launched to ensure energy security for farmers and included dedicated grants to farmers installing solar pumps.Key Enabling ConditionsThe off-grid capital grants programme was a key instrument in part of a broader and much longer-running solar PV application programme, established by the Indian government under its National Solar Mission in 2010. The National Solar Mission established a supportive environment for solar technology adoption, which helped catalyse aggressive scaling of India's overall solar energy capacity. In a sign of ongoing support, in April 2020, the MNRE further extended the off-grid and decentralized solar PV application programme with the goal of creating 118 MWp equivalent solar power by 31 March 2021. Impact / OutcomesThe updated programme aimed to catalyse deployment of 50 MWp by 2017-2018 and 68 MWp by 2019-2020. The total estimated cost was USD 266 million (INR 18,950 million), with the ministry providing USD 89 million (INR 6,370 million) in financial assistance. The capital grants supported installment of 25 kWp solar plants in areas with unreliable or unavailable grid power, often benefiting public service institutions, schools, panchayats, hostels, and police stations. As of October 2018, the programme had deployed over 4 million lanterns and lamps, 1.7 million home lights, 0.6 million streetlights, 0.2 million solar pumps, and 189.0 MWp of stand-alone solar power devices. Additional SourcesAHK (2020), Indien: Eigenversorgung für die Industrie mit Solarenergie (PV & CSP) und Bioenergie – Zielmarktanalyse 2020 mit Profilen der Marktakteure. https://www.german-energy-solutions.de/GES/Redaktion/DE/Publikationen/Marktanalysen/2020/zma-indien-solarenergie-2020.pdf?__blob=publicationFile&v=3 CDKN (2011), Transforming India into a solar power. https://cdkn.org/sites/default/files/files/India-InsideStory_cbc_LR21.pdf MNSE (2019), Invitation for Expression of Interest (EoI) for conducting technical and performance evaluation of the programme/scheme ‘Off-Grid and Decentralized Concentrated Solar Thermal (CST) Technologies for Community Cooking, Process Heat and Space Heating & Cooling Applications in Industrial, Institutional and Commercial Establishments’, https://www.eqmagpro.com/wp-content/uploads/2019/10/EOI11102019_compressed-1-18-1-9.pdf Jethani and Arvindh (2019), Promotion of concentrating solar thermal technologies for industrial, institutional and commercial sectors in India, in Sun Focus Magazine 5(1), https://downloads.unido.org/ot/18/52/18524005/Sunfocus%20magazine_%20Volume%205_Issue%201_2019.pdf Kumar and Majid (2020), Renewable energy for sustainable development in India: current status, future prospects, challenges, employment, and investment opportunities, https://energsustainsoc.biomedcentral.com/articles/10.1186/s13705-019-0232-1 SECI (2009), Jawaharlal Nehru National Solar Mission - Towards Building SOLAR INDIA, https://www.seci.co.in/upload/static/files/mission_document_JNNSM(1).pdf UNIDO (2022), India’s CST Sector – Vision 2022, https://isid4india.org/pdf/CST%20Roadmap-2022.pdf https://www.iea.org/policies/6484-capital-grants-for-off-grid-and-decentralized-concentrated-solar-thermal-cst-technologies-for-community-cooking-process-heat-and-space-heating-cooling-applications-extension?country=India https://www.mercomindia.com/mnre-invites-bids-off-grid-solar https://mnre.gov.in/solar-off-grid/ https://www.solar-payback.com/india-financial-support-concentrating-solar-systems-extended-2020/ https://ndcpartnership.org/knowledge-portal/good-practice-database/transforming-india-solar-power-leader https://pib.gov.in/newsite/PrintRelease.aspx?relid=83765https://mnre.gov.in/solar-off-grid/https://mnre.gov.in/solar-overview/https://www.india.gov.in/spotlight/pm-kusum-pradhan-mantri-kisan-urja-suraksha-evam-utthaan-mahabhiyan-scheme
India
Capital Grant
DescriptionCarbon credit finance schemes integrate the earning and monetization of carbon credits into an eligible project's revenue stream, thereby increasing its revenue. A carbon credit represents a unit generated through activities that reduce or remove greenhouse gas emissions, with each credit equating to 1 metric ton of CO2 equivalent (tCO2e). These credits can result from either avoidance (e.g., capturing methane emissions from landfills) or removal (e.g., afforestation). Carbon credits are issued by various mechanisms (e.g., international treaties, local programs, independent standards). They are traded in markets to meet voluntary or regulatory emission reduction commitments. BenefitsCarbon credit financing provides a mechanism for supporting clean energy projects in emerging economies by generating additional revenue through the sale of carbon credits, attracting investment, enhancing project viability, supporting climate goals, and contributing to sustainable development. This financial approach helps overcome funding barriers and accelerates the deployment of renewable energy solutions. On top of improving project viability, these schemes support global commitments to reduce emissions.  Case StudyA Carbon Credit Finance Scheme to support enhancements of a geothermal project in KenyaCompleted in 2010, the Olkaria II Unit 3 Geothermal Project in Kenya added a 35 MW generator to an existing geothermal plant. The project, owned by Kenya Electricity Generating Company Limited (KenGen), contributed around 276 GWh annually to the national grid. Registered under the UNFCCC's Clean Development Mechanism (CDM) the same year, it issued around 480,000 carbon credits purchased by the World Bank’s Community Development Carbon Fund.Carbon credits significantly improved the economic viability of the project. The carbon credit finance scheme helped mitigate the high initial capital costs and risks associated with geothermal projects, making the project more attractive to investors. The additional revenue supported various community development initiatives and infrastructure improvements, such as water storage, educational facilities, and road upgrades. Moreover, it helped alleviate the financial constraints on expanding renewable energy capacity in Kenya, ensuring a stable supply of clean energy while reducing dependence on fossil fuels. Additional Sourceshttps://ppp.worldbank.org/public-private-partnership/sites/ppp.worldbank.org/files/2023-10/State%20and%20Trends%20of%20Carbon%20Pricing%202023.pdfhttps://www.globalcarboncouncil.com/blog-renewable-energy-projects-the-continuous-need-for-carbon-financing/#https://www.worldbank.org/en/results/2015/08/18/expanding-kenya-renewable-energy-capacity
Kenya
Carbon Credit Finance Scheme
Challenges to InvestmentIn the early 2000s, Brazil was facing challenges with its previous feed-in-tariff system for wind energy, where high tariffs resulted in high costs for consumers. The government saw reverse auctions as a method to drive down the cost and make wind more competitive with other sources. However, Brazil faced several challenges in implementing its reverse auction system. Reverse auctions can lead to aggressive bidding and unsustainably lower prices if not designed properly. Brazil had to carefully structure the auctions to ensure project viability, while also attracting sufficient participation from developers to create real competition. To address this, Brazil provided 20-year power purchase agreements (PPAs) to give revenue certainty and encourage bidding.   ApproachIn 2009, Brazil enacted the Renewable Energy Law, establishing the legal and regulatory framework and fiscal incentives for renewable energy development, including wind energy. The auction required bidders to specify the quantity of power to be supplied and a price for their output in $/MWh. The auction was structured to allow for a 10% margin of error in supply, with power valued at the lower of the contract price, the Reference Value determined by Brazil’s electricity regulator, ANEEL, or the Price for Liquidation of Differences (PLD) based on marginal operating costs.  The auction system was designed to balance supply and ensure that wind energy projects could be developed and operated efficiently, while ensuring that every technically qualified company could participate. The auctions also introduced safeguards such as required environmental permitting and grid access approval prior to bidding, and a deposit and guarantee system to ensure project completion. Brazil held its first wind energy auction in 2009, contracting 71 projects for a total of 1,800 MW. The price ceiling established by ANEEL was US$113.1/MWh, but the final average price was US$65.3/MWh, reflecting greater price competitiveness.  Key Enabling ConditionsThe Lei do Licitação, enacted in 2015, established the legal framework for energy sector auctions, including reverse auctions. It outlines the rules for the auction process, including criteria for bidders, the evaluation of bids, and the conditions for awarding contracts. The Decreto de Licitação, issued in 2018, provided detailed guidelines for implementing auctions under the Lei do Licitação. It includes specific requirements for the preparation of auction documents, the evaluation of bids, and the conditions for awarding contracts. These laws set the foundation for the auction process, including criteria for bidders, bid evaluation, and contract awarding conditions and ensuring rapid project commissioning through stringent requirements and financial safeguards. Impact / OutcomesThe first auctions played a crucial role in expanding wind energy. Brazil successfully added over 3,300 MW of clean energy generation, with projects coming online rapidly, within a 2-3 year lead time from project auction to commissioning. The reverse auctions in 2009 and 2010 established a successful model and policy framework for further expansion of wind, solar, and biomass power. Despite the dominance of fossil fuel generation in Brazil, the reverse auctions catalysed an increase in wind and solar share of total energy supply, from less than 1% to nearly 2% from 2009 to 2018. These policies helped increase wind output by over 300% by the close of the project timelines, in 2012, slowing Brazil’s overall trend towards fossil fuel-based generation during the late 2000s and early 2010s.Additional SourcesAsian Development Bank, Asian Clean Energy Forum: “Reverse Auctions to Scale Renewable Energy: Brazilian Approach”, June 2017, https://asiacleanenergyforum.adb.org/wp-content/uploads/2017/06/4_Auctions_Renewables_Brazilian_Approach.pdfInternational Energy Agency, “Energy Statistics Data Browser: Brazil”, 21 December 2023, https://www.iea.org/data-and-statistics/data-tools/energy-statistics-data-browser?country=WORLD&fuel=Energy%20supply&indicator=TESbySourceInternational Renewable Energy Agency, “Energy Profile: Brazil (2023)”, https://www.irena.org/-/media/Files/IRENA/Agency/Statistics/Statistical_Profiles/South%20America/Brazil_South%20America_RE_SP.pdfhttps://www.sciencedirect.com/science/article/pii/S0301421521002226 https://cms-lawnow.com/en/ealerts/2009/05/1st-wind-energy-auction-brazil
Brazil
Tenders and Auctions
Challenges to investment As a G20 member, India committed in 2009 to “phase out inefficient fossil fuel subsidies that encourage wasteful consumption”. For example, price discounts were offered to kerosene and liquid petroleum gas that were eventually sold at a loss. These subsidies, originally intending to protect consumers by keeping prices low, resulted in substantial fiscal costs, promoted inefficient resource allocation, and encouraged pollution without effectively targeting low-income individuals. Furthermore, a lower dependency on fossil fuels reduces energy security concerns as prices for imported fossil fuels were highly volatile. India faced significant challenges in reforming or phasing out these subsidies, including political challenges and the need for sustained commitment and communication (e.g., India reintroduced diesel subsidies in the build-up to the 2004 national elections). Additionally, many of the subsidies were untargeted, with about 87% of electricity subsidy payments going to households above the poverty line and over half benefiting the richest 40%.  Approach One particular method India used to phase out inefficient fossil fuels was a subsidy swap, or shifting subsidies from one area of focus to another. The subsidy swap was designed to redirect fiscal support from fossil fuel to renewable energy consumption, redirecting part of the demand towards renewable energy and disincentivizing investment in new fossil fuel-based systems. Thereby, the subsidy swap consisted of two key elements: (i) reducing subsidies for fossil fuels and (ii) increasing subsidies for renewable energy deployment. Key Enabling Conditions India pursued self-reports and peer reviews of fossil fuel subsidies as initial steps toward fulfilling the commitment it made in 2009, reflecting its dedication to following international best practices and addressing domestic policy-making needs. Alongside the subsidy efforts, India also implemented additional policy measures to meet the needs of poor, rural households who lacked grid access. For example, India’s 2010 National Solar Mission promoted the installation of solar off-grid and decentralized PV systems for rural populations, targeting 2000MW equivalent of solar off-grid and decentralized PV systems by 2022. In June 2024, off-grid solar reached a capacity 3440MW. Impact / OutcomesBetween fiscal year (FY) 2014 and FY 2017, India shifted public financial flows from petroleum products to electricity transmission, distribution, and renewable energy. Support for petroleum products fell by almost three quarters due to policy reforms and lower world oil prices, while support for renewable energy increased nearly six times. From 2014 to 2021, fossil fuel subsidies, including coal, oil, and gas, dropped by 72% to USD 8.5 billion. Specifically, coal subsidies decreased from USD 2.8 billion in FY 2014 to USD 1.6 billion in FY 2021, and oil and gas subsidies fell from USD 28 billion to USD 6.9 billion over the same period. RE subsidies increased from USD 0.6 billion in 2014 to USD 2 billion in 2017. In part due to increased subsidies, the share of renewables in total power generation increased from around 17% 2014 to 21% in 2021.Additional SourcesI4CE (2017). Fossil Fuel Subsidy Reforms: State of Play and Ways Forward, https://www.i4ce.org/wp-content/uploads/2017-10-20-PC50_Fossil_subsidy_reform-3.pdf IISD-GSI (2019). Fossil Fuel to Clean Energy Subsidy Swaps: How to pay for an energy revolution, https://www.iisd.org/system/files/publications/fossil-fuel-clean-energy-subsidy-swap.pdf IISD-GSI (2017). India’s Energy Transition: Mapping Subsidies to Fossil Fuels and Clean Energy in India, https://www.iisd.org/system/files/publications/india-energy-transition.pdf IISD-GSI (2018). India’s Energy Transition: Subsidies for Fossil Fuels and Renewable Energy, 2018 Update, https://www.iisd.org/system/files/publications/india-energy-transition-2018update.pdf?q=sites/default/files/publications/india-energy-transition-2018update.pdf WEF (2023). Mobilizing Investments for Clean Energy in Malaysia, https://www3.weforum.org/docs/WEF_Mobilizing_Investments_for_Clean_Energy_in_Malaysia_2023.pdf Zinecker, A., Sanchez, L., Sharma, S., Beaton, C., & Merrill, L. (2018). Getting on target: Accelerating Energy Access through Fossil Fuel Subsidy Reform, https://www.iisd.org/system/files/publications/getting-target-accelerating-energy-access.pdf https://www.climatescorecard.org/2023/05/indias-subsidies-for-fossil-fuels-have-dropped-by-72-however-they-are-still-nine-times-higher-than-renewable-energy-subsidies/ https://www.iea.org/data-and-statistics/data-tools/energy-statistics-data-browser?country=INDIA&fuel=Renewables%20and%20waste&indicator=ETISharesInPowerGen https://www.iisd.org/gsi/mapping-india-energy-subsidies-data/about/ https://www.iisd.org/story/mapping-india-energy-policy-2022-update/
India
(Gradual) Removal of Fossil Fuel Subsidies
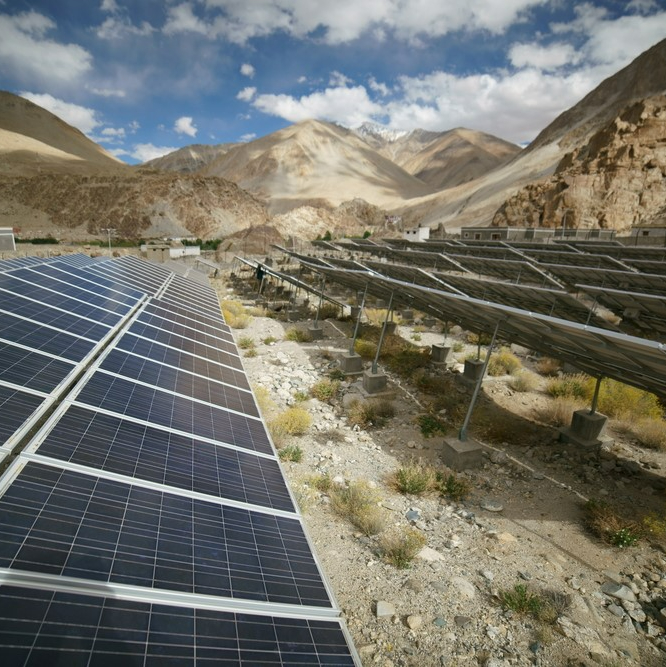
Challenges to investment In the late 2000s, India faced a significant energy challenge to sustain its economic growth. The country needed to at least triple its primary energy supply and increase electricity generation five to six times to meet its growth targets. Moreover, approximately 400 million Indians still lacked access to electricity and had severely limited access to renewable energy in 2009. At the time, India depended on oil imports for 80% of its oil needs. To address these issues, India recognized the essential role of low carbon technologies, related policies, and goals. Approach Inaugurated in January 2010, the Government of India and State Governments initiated the Jawaharlal Nehru National Solar Mission (JNNSM), or the National Solar Mission, aiming to promote solar power across the country. The mission sought to establish India as a global leader in solar energy by creating favorable policy conditions for its deployment both centrally and locally. Thereby, the mission adopted a three-phase approach from 2010 to 2022 with different policies and targets. After two revisions being in force, the JNNSM set a target of 100 GW of solar photovoltaic (PV) by 2022. Phase I (2010-2013) aimed for 1 GW of grid-connected PV and 200 MW of off-grid solar PV applications. Phase II (2014-2017) set a cumulative target of 10 GW for grid-connected PV and 1 GW for off-grid applications. Lastly, Phase III (2017-2022) aimed for a cumulative target of 100 GW for grid-connected PV, up from the original 20 GW, and 2 GW for off-grid applications. The government assessed progress at the end of each phase and midway through the last two phases, allowing adjustments to capacity and targets to manage the subsidy burden if anticipated cost reductions failed to materialize as the technology advanced. Key Enabling Conditions As one of the eight missions of the National Action Plan on Climate Change (NAPCC), the mission was accompanied by various other solar initiatives and programs, such as the center as well as state rooftop installation scheme and the scheme for the Development of Solar Parks and Ultra Mega Solar Power Projects. These efforts were jointly aimed at creating a market for solar energy, promoting its development, and creating synergies with other missions.Impact / OutcomesIn 2010, India had only around 10 MW of installed solar capacity. Four years after the start of the National Solar Mission, it had surpassed its first-phase target with 2.6 GW, which led to a revision of the overall target in 2015 from 20 GW to 100 GW by 2022. However, the revised target was not met with 70.1 GW and further 55.6 GW still under construction by June 2023. Nevertheless, solar power capacity increased 30 times since 2014, reaching 82.6 GW by April 2024, making India the fifth largest country for PV capacity in the world. The off-grid capacity target was met, having reached 2.7 GW, which includes 11.12 million solar lights by October 2023. Finally, the proportion of the population with electricity access rose from 67.9% in 2010 to 100% in 2022.Additional SourcesGovernment of India and Ministry of New and Renewable Energy (2010). Jawaharlal Nehru National Solar Mission: Towards Building SOLAR INDIA, https://policy.asiapacificenergy.org/sites/default/files/mission_document_JNNSM.pdf Government of India and Ministry of New and Renewable Energy (2015). Ministerial Resolution on Scaling Up of Grid Connected Solar Power Projects to 1,00,00 MW by the year 2021-22 Under National Solar Mission, https://policy.asiapacificenergy.org/sites/default/files/Resolution%20Scaling%20up%20solar.pdf Shrimali, G., & Rohra, S. (2012). India’s solar mission: A review. Renewable and Sustainable Energy Reviews, 16(8), 6317-6332., https://wgbis.ces.iisc.ac.in/biodiversity/sahyadri_enews/newsletter/issue45/bibliography/India's%20solar%20mission.pdf https://www.iea.org/policies/4916-jawaharlal-nehru-national-solar-mission-phase-i-ii-and-iii?s=1 IEA (2023), Energy Statistics Data Browser, IEA, Paris https://www.iea.org/data-and-statistics/data-tools/energy-statistics-data-browser https://www.iitj.ac.in/CSP/material/JNNSM-Final.pdf https://www.investindia.gov.in/sector/renewable-energy https://mnre.gov.in/year-wise-achievement/ https://pib.gov.in/PressReleasePage.aspx?PRID=1992732 https://www.theindiaforum.in/environment/indias-solar-journeyhttps://pib.gov.in/PressReleasePage.aspx?PRID=1992732
India
Target for Renewable Energy Deployment
Challenges to investmentIndia's energy transition presented an opportunity to strengthen the local economy in the renewable energy (RE) sector. Despite the nascent state of the renewable energy industry in the early 2000s, one of India’s national goals was to support domestic companies and enhance local manufacturing capacity. If policies helped to create new jobs, the government expected public support for renewable technologies to be increased. Moreover, India sought to spur new innovations and level the competition between domestic and international manufacturers who dominated the renewable energy industry, potentially catalyzing a cost-effective domestic supply chain in the long run.ApproachIn 2009, India launched the Jawaharlal Nehru National Solar Mission, or the National Solar Mission (NSM), which, among other goals, aimed to establish a domestic manufacturing industry for solar energy. The initiative sought to reach a 4-5 GW equivalent of installed annual manufacturing capacity by 2020. To achieve this goal, the government enacted local-content requirements (LCR) for select solar technologies, which would be phased in over time. During Phase I of the program (2010-12), the enforced LCRs only applied to crystalline silicon technologies. In Phase II (2013-17), project developers needed to procure locally made solar photovoltaic (PV) to participate in the domestic content requirement (DCR) auctions held under the NSM. Alternatively, developers could enter open auctions that did not have LCRs, or they could participate in both DCR and open auctions by submitting separate bids. In 2018, the Ministry of New and Renewable Energy (MNRE),the nodal body for renewable energy in India, issued orders to implement “Make in India” rules for the public procurement of clean power in India. It required a 100% local content requirement for solar modules in grid-connected plants and 70% for off-grid/ decentralized solar projects for all projects tendered by the federal government, ministries and public sector undertakings.Key Enabling ConditionsThe NSM was accompanied by other solar initiatives and programs jointly creating a market for solar energy and its development. For instance, the following Make in India policy in 2018 aimed to continue the initial success by fostering the environment for domestic solar manufacturing.Impact / OutcomesDuring Phase I, India's manufacturing capacity for crystalline silicon modules grew by 135%, partly due to LCRs. Extending the LCRs to thin-film products in DCR auctions in Phase II, the construction of crystalline silicon module-making capacity accelerated further, increasing by 27% per year, compared to 9% annually in Phase I. However, solar panels procured under LCRs between 2014-17 were about 14% more expensive than imported PV modules, resulting in a cost increase of around 6% per kWh. This additional expense added between USD 69 million and USD 88 million per installed GW of solar PV under the LCRs. Still, the LCRs in this period helped to spur innovation, resulting in a significant rise in new patent applications from Indian entities. Between 2014 and 2018, India’s solar production capacity grew from 0.2 GW to 0.8 GW, while the installed solar power generation capacity expanded from 3.3 GW to 28.9 GW. LCRs have played a significant role in the 135% growth in the manufacturing capacity of crystalline silicon modules in phase 1. After the “Make in India” announcement, domestic manufacturers expressed significant confidence in ramping up their manufacturing capacities. As of 2022, India had an installed PV cell manufacturing capacity of 3 GW/year and a PV module capacity of 10 GW/year.Additional SourcesBazilian, M., Cuming, V., & Kenyon, T. (2020). Local-content rules for renewables projects don't always work. Energy Strategy Reviews, 32, 100569, https://doi.org/10.1016/j.esr.2020.100569 Hansen, U. E., Nygaard, I., Morris, M., & Robbins, G. (2019). Local content requirements in auction schemes for renewable energy: Enabler of local industrial development in developing countries? UNEP DTU Partnership Working Paper Series 2019 No. 2, https://backend.orbit.dtu.dk/ws/portalfiles/portal/193202331/Effects_Local_Contents_WEB.pdf Johnson, O. (2013). Exploring the effectiveness of local content requirements in promoting solar PV manufacturing in India (No. 11/2013). Discussion Paper, https://unctad.org/system/files/non-official-document/DITC_TED_13062013_Study_GDI.pdf Probst, B., Anatolitis, V., Kontoleon, A. et al. (2020). The short-term costs of local content requirements in the Indian solar auctions. Nat Energy 5, 842–850, https://doi.org/10.1038/s41560-020-0677-7 https://www.pv-magazine-india.com/2019/02/07/government-prioritizes-indian-products-in-plan-for-12-gw-of-new-solar/ https://www.pv-magazine-india.com/2020/08/21/manufacturers-want-50-basic-customs-duty-on-solar-imports/ https://www.pv-magazine-india.com/2020/09/11/local-content-requirement-costs-for-large-scale-pv-in-india/
India
Local Content Requirements
Challenges to investment In the early 2000s, an energy efficient building code was proposed to face Jordan’s challenges regarding energy usage from the residential sector, which accounted for close to 24% of total expenditure. The lack of thermal efficiencies in residential buildings led to increased energy consumption and costs, especially in winter and summer seasons. In addition, Jordan’s high energy dependency on imports—94.1% of energy use in 2000—triggered a set of reforms to reduce vulnerabilities on external shocks to energy prices and reliability.Approach In 2008, the Jordan National Building Council (JNBC), under the Ministry of Public Works and Housings, contracted the Building Research Center at The Royal Scientific Society to develop a new “Energy Efficiency in Buildings Code”. The objective of the Code was to improve building’s thermal performance and minimize the overall energy consumption in building constructions. The code represented an update to Jordan’s 1998 Energy Code, where standards for thermal insulation were originally introduced.The code was prepared utilizing local, regional, and international resources. In addition, experts from the Jordan construction market assisted in developing the code and adapting it to Jordan's market needs. It combined architectural aspects with mechanical considerations, and electrical principles, representing the first sustainable building related code of the region.This code aimed to reduce energy consumption, promote sustainable practices, and create a greener built environment by establishing guidelines for energy-efficient design and construction practices. It covered various aspects of building energy consumption, including lighting, HVAC systems, insulation, and renewables integration. Key Enabling Conditions Several key factors have driven the success of the development and implementation of the Energy Efficient Building Code in Jordan. The construction industry awareness of these changes and its ability to enforce the new codes on all new buildings was key to extract the program’s associated benefits. In its inception, the criteria used to establish the codes, and panel of stakeholders selected for its development ensured that regional and international best practices were surfaced early on. Lastly, the country’s reliance on market imports for its energy security acted as a strong incentive to adopt the new code.Impact / OutcomesBy 2017, The Ministry of Public Works and Housing had elaborated several Building Codes, out of which seven were related to energy performance, including the Energy Efficient Building Code and the Thermal Insulation Code.Jordan’s energy efficient building codes have significantly enhanced energy efficiency in the country’s construction industry. As captured in the second National Energy Efficiency Action Plan for Jordan 2018-2020, published in 2017, it is estimated that these codes will have covered about 66,000 new dwellings during the following five years. In addition, annual electricity savings were estimated to around 401 GWh by 2020, leading to about 188kt Co2 emissions reduction. Additional SourcesEnergy Efficient Building Code for Jordan T. Awadallah, H. Adas, Y. Obaidat, I. Jarrar Royal Scientific Society, Amman, 1438, Jordan, https://bcapcodes.org/wp-content/uploads/2023/09/energy-code-jordan.pdf Ministry of Public Works and Housing. https://mpwh.gov.jo/Default/Ar Jordan National Building Council (JNBC) http://www.jnbc.gov.jo/# NetZero Buildings in Jordan. Friedrich-Ebert-Stiftung, 2020 https://library.fes.de/pdf-files/bueros/amman/16876.pdf International Code Council. Jordan. https://www.iccsafe.org/adoptions/country/jordan World Bank Data. Energy imports, net (% of energy use) - Jordan https://data.worldbank.org/indicator/EG.IMP.CONS.ZS?locations=JO The Second National Energy Efficiency Action Plan (NEEAP) for the Hashemite Kingdom of Jordan. Jordan Renewable Energy & Energy Efficiency Fund, 2017. https://www.memr.gov.jo/EBV4.0/Root_Storage/AR/EB_Info_Page/2nd_NEEAP_(2018-2020)_final__clean_November__2017_(2).pdfMinistry of Energy & Mineral Resources The Hashemite Kingdom of Jordan. Jordan Energy Strategy Action Plan 2020-2030. https://www.memr.gov.jo/EBV4.0/Root_Storage/EN/EB_Info_Page/Second_edition_-_JES_action_plan.pdfMinistry of Environment. Energy Sector, Green Growth National Action Plan 2021-2025 https://www.sustainability.gov/pdfs/ggi-jordan-energy.pdf
Jordan
Energy Efficient Building Code
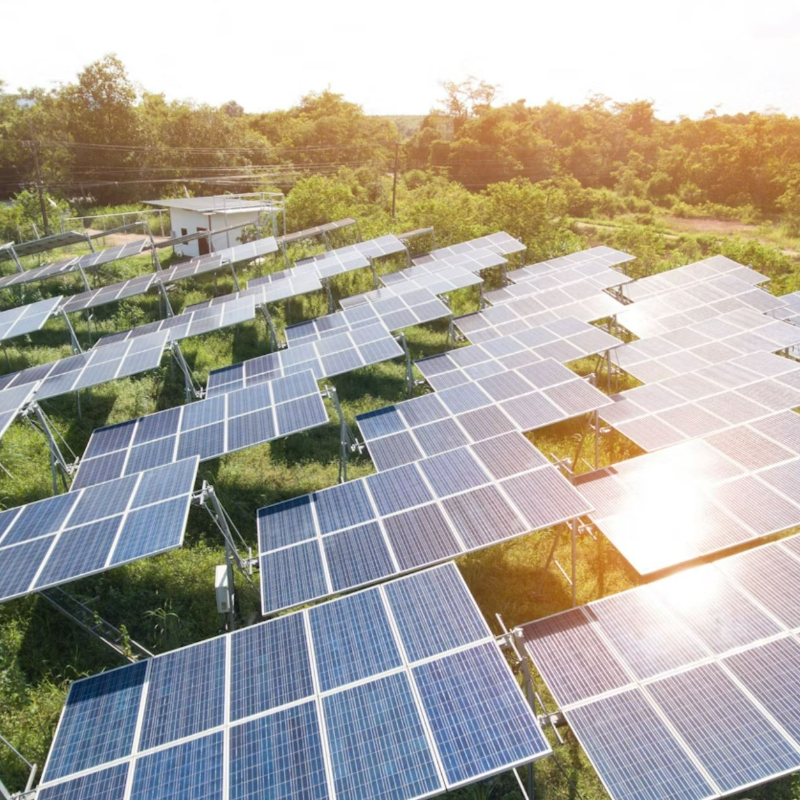
Challenges to InvestmentIn the 2000s, electricity demand in Thailand was increasing by 4-5% per year. The Thai government sought to reduce its dependence on fossil-fuel generation, which represented 81% of total energy supply in 2007 and was reliant on imports. Despite a goal to raise renewable energy to 20% of final energy consumption by 2022 (per Thailand’s Renewable Energy Development Plan 2008-2022), subsidies for fossil fuels meant solar and other renewables were not competitive. Potential renewables investors also faced high duties on imported equipment, limited participation from local banks, constrained fiscal support for investment, and restrictions on foreign investment in energy transmission and distribution (per Foreign Business Act 1999). ApproachTo address these challenges, in 2007, Thailand introduced a policy which provided a feed-in premium, known as an "adder", for eligible clean energy projects (solar, wind, hydro, biogas). The adder had a simple, easy-to-understand structure for investors to estimate project returns and reduce risk, encouraging adoption by guaranteeing an electricity purchasing price. The premium added THB 8/kWh (USD0.27/kWh) on top of the base tariff for 10 years. In 2010, the rate was reduced to THB 6.5/kWh (USD0.22/kWh), as the measure was over-subscribed and solar energy costs had fallen. Key Enabling ConditionsBy 2007, Thailand had already established key enabling legislation and complementary initiatives that allowed the adder policy to be successful. The Renewable Energy Development Plan (REDP 2008-2022) and, later, the Renewable Alternative Energy Development Plan 2012-2021 (AEDP 2012-2021), set ambitious targets for clean energy deployment, while the Energy Conservation Promotion Act 1992 established the Energy Conservation (ENCON) fund, which supports clean energy projects via equity/debt arrangements, credit guarantees, and technical assistance. Thailand had also established a Carbon Credit guarantee facility and several fiscal incentives for clean energy investment, including import duty exemptions and income tax exemptions for clean energy manufacturing and consulting. The combination of incentives and well-developed policy allowed the simple adder measure to have a greater impact. At the time of writing, the Ministry of Energy (MOE) was in the process of developing the new Power Development Plan (PDP 2024) and the new Alternative Energy Development Plan (AEDP 2024) which respectively aimed to increase the share of RE electricity generation to 50%, and the share of RE consumption to 30% by 2037. These ambitious targets shall act as additional positive signals to boost investors confidence on top of the already strong Feed-in-Tariff (FiT) system put in place since 2013.Impact / OutcomesWhile the measure was an intermediary step to jump start clean energy projects before a Feed-in-Tariff (FiT) was later on introduced [see below], it was very successful in increasing solar energy generation, especially solar farms which contributed 99% of Thailand's solar power capacity by the end of 2013 (782 MW). It also contributed to increased access to electricity, which rose from 94% in 2007 to 99% by 2014 and a 3% increase in renewables’ share of total energy consumption over the same period. However, after some time, the government became concerned that the adder measure was over-subscribed due to the attractive tariff prices, at significant cost to the government. In addition, the adder measure meant that higher electricity costs would be passed on to consumers. As a result, the government temporarily suspended solar energy purchasing and lowered the adder premium in 2010. In 2013, the government shifted from the adder premium to a fixed Feed-in-Tariff (FiT), creating a more dynamic pricing system based on market prices rather than a fixed premium. Under the current Thai FiT system, energy producers who generate electricity from renewable sources can sell the electricity they produce to the national grid at a predetermined, fixed rate for a specific period. This fixed rate is often set above market prices to encourage investment in renewable energy projects, following a 3-part formula that includes (1) a FiT fixed (FiTF) which is calculated from the cost of power plant construction, operation, and maintenance (O&M) throughout the life of the plant; (2) a FiT variable (FiTV) which is calculated from the cost of fuel used in electricity generation, which changes over time (used for renewable energy in the bioenergy group); (3) a FiT Premium, which incentivizes investment in certain types of fuels, such as waste, biomass, biogas, and select projects that can enhance energy security of the southern provinces.Additional SourcesInternational Institute for Sustainable Development, ‘Incentives for Renewable Energy in Southeast Asia: Case Study of Thailand”, February 2013 https://www.iisd.org/system/files/publications/investment_incentives_thailand.pdfInternational Energy Agency, “Energy Statistics Data Browser: Thailand”, 21 December 2023, https://www.iea.org/data-and-statistics/data-tools/energy-statistics-data-browser?country=WORLD&fuel=Energy%20supply&indicator=TESbySourceInternational Renewable Energy Agency, “Energy Profile: Thailand (2023)”, https://www.irena.org/-/media/Files/IRENA/Agency/Statistics/Statistical_Profiles/Asia/Thailand_Asia_RE_SP.pdfEconomic Research Institute for ASEAN and East Asia, “Status on Renewable Energy SPP and VSPP”, August 2019 https://www.eria.org/uploads/media/8_RPR_FY2018_09_Chapter_1.pdfhttps://citeseerx.ist.psu.edu/document?repid=rep1&type=pdf&doi=02b3767bb1f4c09f5caaf813cb2d4ef3359d47f0https://www.researchgate.net/publication/285781983_Assessment_of_Feed-in_Tariff_Policy_in_Thailand_Impacts_on_National_Electricity_Prices https://www.adb.org/sites/default/files/linked-documents/49087-001-so.pdf
Thailand
Feed-in Premiums
Challenges to investmentIn 2003, Kenya’s energy sector was marked by unreliable electricity, coupled with significant affordability issues. The National Energy Policy in 2004 formulated detailed reforms to address the situation. This was Kenya’s first policy attempt to mandate the promotion of private sector investments in renewable energy (RE). Still, Kenya required RE regulations and investment-enabling reforms to implement the National Energy Policy of 2004, particularly those which would establish equal treatment for foreign and domestic investors and therefore attract private RE investment.  ApproachThe Energy Act of 2006 liberalized Kenya’s electricity sector, repealing the Power Act of 1997, and established laws relating to RE and energy efficiency to attract private investment. In particular, the act unbundled electricity generation from transmission and distribution, allowing private sector investment in power generation via Independent Power Producers (IPPs). The Act also established the Energy Regulatory Commission (ERC) to regulate production, distribution, supply and use of renewable energy among others. Additionally, the Investment Promotion Act (2004) regulated overall investment activities in Kenya, including foreign direct investment, and established the Kenya Investment Authority (KenInvest) to promote and facilitate both domestic and foreign investments. These reforms institutionalized protections for foreign RE investors, building on the 1976 Foreign Investment Protection Act (FIPA), which ensured foreign investors’ property cannot be nationalized without full compensation and allowed for unrestricted capital repatriation and transfer of profits in approved foreign currencies. Key Enabling ConditionsInternational initiatives and organizations such as Power Africa, the World Bank, Agence Française de Développement (AFD), the African Development Bank (AfDB), the British International Investment (BII), the German Development Bank (KfW), and the European Investment Bank (EIB) have provided financial support and technical assistance to IPPs to reach financial closure. Moreover, KenInvest has built on the initial success of the energy sector reforms by launching the Kenya Investment Policy and the Country Investment Handbook in 2019. Impact / OutcomesInvestments in RE, though not an explicit investment opportunity category under KenInvest, qualified for investment promotion activities because they improved Kenya’s standard of living through the production and utilization of RE. In total, wind and solar grew from near-zero share of power generation in 2006 to 17.4% of Kenya's total power generation in 2021, with wind alone contributing 16%. Approved RE projects by 2021 included Cedate and Selenkei Solar (40MW each), Alten Solar (40MW) Malindi Solar (40MW), Kipeto Wind (100 MW), Chania Green Wind (50MW),and several smaller projects ranging from 0.5 to 2.0 MW. The largest private investment was the Lake Turkana Wind Power Project. The project, estimated at $800 million, began construction in 2014 and entered commercial operation in June 2018. With a contracted capacity of 310 MW, the Turkana Wind Park provided enough power for 1 million households and offset around 737,000 tons of carbon dioxide emissions annually. The steps taken by Kenya to ensure capital repatriation for investors were absolute key enablers of these developments.Additional SourcesBowmans (2022). Foreign Direct Investment Regimes 2022, https://www.bowmanslaw.com/wp-content/uploads/2021/11/FDIR22_Chapter-3_Bowmans.pdf Energy Charter Secretariat (2016) Energy in the East African Community: The Role of the Energy Charter Treaty, https://www.energycharter.org/fileadmin/DocumentsMedia/Occasional/Energy_in_the_East_African_Community.pdf Eberhard, A., Gratwick, K., Morella, E., & Antmann, P. (2016). Independent power projects in Sub-Saharan Africa: Lessons from five key countries. World Bank Publications, https://documents1.worldbank.org/curated/en/795581467993175836/pdf/104779-PUB-Box394885B-PUBLIC-pubdate-4-1-16.pdf Eberhard, A., Gratwick, K., & Kariuki, L. (2018). Kenya's lessons from two decades of experience with independent power producers. Utilities Policy, 52, 37-49, https://www.gsb.uct.ac.za/files/KenyasLessonsFromTwoDecades.pdf Kapika, J., & Eberhard, A. (2013). Power-sector reform and regulation in Africa: lessons from Kenya, Tanzania, Uganda, Zambia, Namibia and Ghana. HSRC Press.Ministry of Planning and National Development (2003). Economic Recovery Strategy For Wealth and Employment Creation 2003-2007, https://www.dkut.ac.ke/downloads/honorary-page/Economic%20Recovery%20Strategy.pdfOlang, T., and Esteban, M. (2015). Sustainable Renewable Energy Financing: Case Study of Kenya, https://www.researchgate.net/profile/Miguel-Esteban-5/publication/308645481_Sustainable_Renewable_Energy_Financing_Case_Study_of_Kenya/links/59dd4a6aaca272b698e15916/Sustainable-Renewable-Energy-Financing-Case-Study-of-Kenya.pdf UNDP (2020). Engaging private sector in NDC implementation - Assessment of private sector investment potential in the energy sector, https://climatepromise.undp.org/sites/default/files/research_report_document/undp-ndcsp-kenya-private-sector.pdfIEA (2023), Energy Statistics Data Browser, IEA, Paris https://www.iea.org/data-and-statistics/data-tools/energy-statistics-data-browser https://www.invest.go.ke/about-us/ https://www.invest.go.ke/2023/01/11/kenyas-renewable-power-generation-hits-86pct-total-output/ https://www.power-technology.com/data-insights/power-plant-profile-malindi-solar-pv-park-kenya/?cf-view https://www.power-technology.com/data-insights/power-plant-profile-lake-turkana-wind-power-project-kenya/?cf-view https://theexchange.africa/industry-and-trade/foreign-direct-investments/ https://www.state.gov/reports/2023-investment-climate-statements/kenya/
Kenya
Capital Repatriation
Challenges to InvestmentInvesting in energy efficiency presents several challenges, particularly because the business models of energy suppliers and retailers are economically at odds with the goals of energy-saving initiatives. Energy retailers, whose profitability often relies on increasing energy consumption, face conflicting incentives when asked to promote energy efficiency. Additionally, traditional public interventions like standards, taxes, or contributions to the national funds often apply uniformly, regardless of the varying costs or capacities of different actors to achieve energy efficiency. This "one-size-fits-all" approach can further hinder investment by not considering the differing economic contexts of energy suppliers, making energy efficiency investments less attractive compared to their core business activities. ApproachThe French White Certificates scheme, known as Certificats d'Économies d'Énergie (CEE), was created in 2005, as a core instrument to manage energy demand and promote energy efficiency. The program required energy suppliers to achieve specific energy-saving targets, measured in kWh cumac. The scheme was designed to operate on a triennial basis, with energy suppliers incentivized to encourage energy-saving measures among their customers in various sectors, including residential, commercial, and industrial.The first phase of the scheme took place from mid-2006 to mid-2009, with the overall national energy-saving target set at 54 TWh cumac. Energy suppliers could choose to either directly implement energy-saving measures or purchase White Certificates from other eligible entities that had successfully carried out energy-saving operations. To ensure transparency and accountability, a national registry was established to record the transactions and ownership of White Certificates.Following the success of the first phase, with savings of over 65.3 TWh cumac by July 2009, a second phase was introduced in 2011 under the National Commitment for the Environment Law (Law no. 2010-788). This phase, which ran from 2011 to 2014 raised the ambition of the program, setting a new national target of 447 TWh cumac. Moreover, the program's scope was expanded to include automotive fuel suppliers. This period also introduced new rules to ensure that larger energy providers bore a more proportionate share of the energy-saving burden.Key Enabling ConditionsA key enabling condition of White Certificates is the liberalization of the national energy retail market, as the mechanism relies on private sector financing to drive energy savings. The penalty asked to energy suppliers in case specific energy targets are not met is also key to this device. The flexibility provided by the system, allowing suppliers to either implement their own energy-saving actions or purchase white certificates from other eligible actors was key to its adoption. Lastly, the creation of standardized operation sheets further streamlined the process, simplifying the calculation of energy savings and ensuring that common efficiency improvements, such as insulation or heating upgrades, could be easily quantified. Impact / OutcomesSince its launch, the White Certificate scheme consistently exceeded its energy savings targets. In the first phase (2006-2009), over 65.3 TWh cumac of energy savings were achieved, surpassing the 54 TWh cumac target. The second phase (2011-2014) set a higher goal of 447 TWh cumac and delivered 603.2 TWh cumac, 20% above the target. These results were driven primarily by residential projects but also included improvements in industrial processes, public lighting, and transport. The scheme continued through a third phase (2015-2017) and into a fifth phase (2021-2025), with targets rising to 2,400 TWh cumac. Each phase introduced refinements to expand sectoral reach and flexibility, enabling obligated parties to participate in government-approved programs.While White Certificates have shown great success in France and other EU countries, they present interesting learnings for potential replication and scaling in an EMDE context, in a way that accelerates energy savings and affordably supports climate goals.Additional Sourceshttps://www.iea.org/policies/1854-white-certificate-scheme-obligationA Practical Guide to EECs, the certificates that will monetize efficiency projects - Magnus Commodities (magnuscmd.com)https://urldefense.com/v3/__https:/www.frontier-economics.com/uk/en/news-and-insights/news/news-article-i10178-spain-joins-white-certificates-to-boost-energy-efficiency/__;!!Im8kQaqBCw!qLI2IQHZJPfUz9bwJXUGpgun_mSeuyhMGGB0y8avF4d77_n4MmJvACyjumm_6feE6zpjj3LovIa1Jr9cSAsPoQ$CEE entreprises : Prime & subvention | Dispositif et éligibilité (acciona-energia.fr)
White Certificates
DescriptionProject preparation financing is a de-risking mechanism which consists in financing project preparation activities. Project preparation activities take place prior to financial close and cover a wide range of activities (e.g. establishing the enabling environment, project definition, project feasibility assessment, financial structuring).Project preparation activities can be financed through a number of different facilities. Project Preparation Facilities (PPFs) are dedicated structures, oftentimes dependent on MDBs, that finance project preparation activities mainly through grants. Other entities may also finance project preparation activities through grants (e.g. trust funds, donor programs) or through risk capital or loans (e.g. DFIs, governments).Certain characteristics are regarded as key for PPFs to fulfil their de-risking role successfully: a focused mandate (e.g. specific technologies, project size) in line with their funding capacity; flexible procedures, eligibility criteria and application processes to reflect market developments; and a long lifetime to build on lessons learned and develop expertise. The duration of the PPF can be extended with a self-sustaining funding model, such as repayable grants or convertible instruments. BenefitsBy laying the necessary technical, financial, legal, and governance foundations, project preparation funding helps to reduce the risks typically occurring during the preparation cycle. It increases the likelihood of attracting both public and private sector investment in the subsequent construction cycle. It helps ensure that projects meet necessary conditions such as technical feasibility, regulatory approvals, financial viability, and community acceptance.Figure 1: Sources of financial resources for project preparationSource: ICA, Assessment of Project Preparation Facilities for Africa, 2012, https://www.icafrica.org/fileadmin/documents/Knowledge/ICA_publications/ICA-PPF-Study%20Report-ENGLISH-VOL%20A.pdfCase StudyAfDB infrastructure Project Preparation Facility The New Partnership for Africa's Development - Infrastructure Project Preparation Facility (NEPAD-IPPF) is a special multi-donor fund established in 2005 and hosted by the African Development Bank (AfDB). The NEPAD-IPPF supported regional integration and sustainable infrastructure development in Africa (e.g. power transmission). The facility provided grants for various project preparation activities (i.e. pre-feasibility studies, feasibility studies, project structuring, capacity building) therefore supporting the creation of an enabling environment for regional infrastructure development. These grants helped de-risk projects by ensuring that they were investment-ready, thereby attracting financing from the public and private sectors.NEPAD-IPPF targeted projects in the energy, transport, information and communication technologies, as well as water resources management sectors. The initiative played a crucial role in improving regional connectivity for intra-African trade, in line with the African Continental Free Trade Area (AfCFTA) and the African Union's Agenda 2063. Between 2004 and 2022, the Facility approved 106 grants totaling USD 115 million, leveraging USD 11 billion in investment financing.Additional SourcesICA, Assessment of Project Preparation Facilities for Africa, 2012, https://www.icafrica.org/fileadmin/documents/Knowledge/ICA_publications/ICA-PPF-Study%20Report-ENGLISH-VOL%20A.pdfCity Climate Finance Leadership Alliance, Summary of Good Practice of Successful Project Preparation Facilities, 2018, https://gib-foundation.org/wp-content/uploads/2021/08/20180201_PPF_Report_final.pdfUSAID, Assessment of project preparation facilities, 2016, https://pdf.usaid.gov/pdf_docs/PA00M24X.pdfhttps://www.afdb.org/en/topics-and-sectors/initiatives-partnerships/nepad-infrastructure-project-preparation-facility-nepad-ippf
Africa
Project Preparation Financing
Challenges to investmentDriven by heavy mining and manufacturing activity, South Africa’s economy is highly energy-intensive relative to emerging markets and developing peers. In the early 2000s, South Africa’s energy intensity was 10-15% higher than other sub-Saharan African countries and 20-30% higher than middle income peers. During that period, South Africa faced key barriers to energy-efficient investments, including high installation costs and perceived poor returns on investment. As a result of these factors, combined with historically low energy costs, businesses and government de-prioritized energy efficiency.  ApproachIn 2005, South Africa's Department of Minerals and Energy (DMRE) launched the National Energy Efficiency Strategy (NEES), setting a national target to reduce energy demand by 12% annually to 2015. Sub-objectives included: enhancing energy security, improving South Africa’s competitiveness through reduced input cost, and decoupling economic growth from energy consumption and GHG emissions. Targets were differentiated by industry and mining, power and transport generation, public and commercial buildings, and residential sectors. To achieve the NEES targets, South Africa introduced a mix of promotional and policy measures. The Minister and over 40 industrial and commercial energy consumers voluntarily signed the Energy Efficiency Accord. Fiscal and policy initiatives included the promotion of smart meters and solar PVs for residential use and mandatory efficiency standards.Following the energy crisis – starting in 2007 – three reviews assessed the performance of the NEES and identified relevant programmes and stakeholders to help meet national targets. The first review, in 2008, introduced tax deductions on savings on a kilowatt-hour equivalent basis. Implemented in 2013, the tax deductions helped businesses mitigate the high initial capital costs of energy-efficient technologies. The review also criticized the lack of a monitoring system, baseline information, and unclear definitions of energy efficiency, leading to significant changes during the second review in 2013. NEES-related legislation, regulations, and standards were also assessed, and sectoral workshops evaluated the NEES’ scope and components, resulting in an Energy Efficiency Target Monitoring system to measure the NEES’ progress. The third review in 2016 established post-2015 targets and other measures for the NEES. Key Enabling ConditionsOn top of NEES-led measures, privately led initiatives were launched to support the NEES targets. The Industrial Development Corporation's Green Energy Efficiency Fund supports the financing of energy efficiency and renewable projects within energy-intensive industries, whilst the Energy Efficiency Leadership Network works to mobilize businesses’ implementation of energy efficiency initiatives and shares best practices to achieve the NEES targets. Eskom's Integrated Demand Management (IDM) programme implements energy efficiency projects, demand response programmes, and consumer education to reduce electricity consumption.Impact / OutcomesFrom 2005 to 2008, 14 signees of the Energy Efficiency Accord invested ZAR9.9 billion on energy efficiency improvements and saved 1,441 GWh and 5,190 Terajoules of energy. 2014 to 2018 marked significant energy savings, bolstering the economy amid the ongoing energy crisis. Notable reductions were achieved in the transport (39.9 PJ total savings) and buildings sector (26.4 PJ total savings). Implemented in 2013, the NEES’ tax deductions for energy-efficient technologies prompted companies to invest in these technologies, resulting in estimated energy savings of 3,031 GWh in 2013. Additional SourcesDepartment of Minerals and Energy (2005), National Energy Efficiency Strategy https://www.gov.za/sites/default/files/gcis_document/201409/energy-efficiencystrategy051.pdfDepartment of Minerals and Energy (2009), Review of National Energy Efficiency Strategy https://www.energy.gov.za/EEE/Review%20of%20National%20Energy%20Efficiency%20Strategy%202008.pdfDepartment of Energy (n.d), Overview on the National Energy Efficiency Strategy (NEES) https://www.energy.gov.za/files/IEP/DurbanWorkshop/Overview-on-the-National-Energy-Efficiency-Strategy.pdfDepartment of Energy (2013), Overview on the National Energy Efficiency Strategy (NEES) Post 2015, https://www.energy.gov.za/files/IEP/jhb_workshop/Overview-on-the-National-Energy-Efficiency-Strategy-Post2015-26Sep2013.pdfDepartment of Environmental Affairs (2014), Energy Efficiency in South Africa: Governance Structure & Lessons, https://unfccc.int/sites/default/files/1_south_africa.pdfInternational Energy Agency (2015), Energy Efficiency Potential in South Africa – Sizing up the opportunityhttps://iea.blob.core.windows.net/assets/28ad2d02-a8bb-47f1-a436-211e89f5276e/EnergyEfficiencyPotentialinSouthAfrica.pdfDepartment of Energy (2009), National Energy Efficiency Strategy for South Africa, https://www.gov.za/documents/national-gazette-no-32342-26-june-2009-volume-528Department of Energy (2016), Post-2015 National Energy Efficiency Strategy: Comments Invited, https://www.gov.za/documents/post-2015-national-energy-efficiency-strategy-comments-invitedhttps://www.iea.org/articles/e4-country-profile-energy-efficiency-in-south-africahttps://www.energy.gov.za/files/eee_frame.html#:~:text=URL%3A%20https%3A%2F%2Fwww.energy.gov.za%2Ffiles%2Feee_frame.html%0AVisible%3A%200%25%20https://www.eskom.co.za/eskom-divisions/tx/demand-response/https://www.iea.org/policies/3465-national-energy-efficiency-strategy-post-2015https://www.savingenergy.org.za/programmes/index.html
South Africa
National Energy Efficiency Strategy
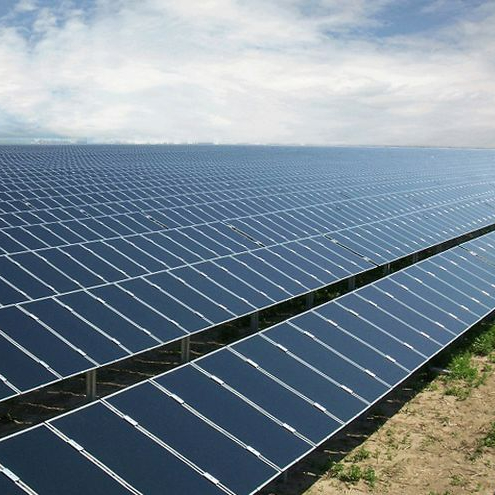
Challenges to InvestmentLaunching the National Solar Mission in 2010, India set a target to deploy 100 GW of solar PV by 2022. However, the government faced several challenges to realizing its ambitious target. First, the lack of awareness and understanding among consumers about the benefits of solar energy led to slower adoption and limited demand. Additionally, the high upfront costs of solar PV systems posed a financial barrier for many individuals and businesses, highlighting the need for sustained investment incentives that would ensure solar capacity growth. To overcome these challenges, the government provided various initiatives, subsidies, and incentives to promote solar investment. ApproachAs early as the 1990s, the Indian government considered using accelerated depreciation as an incentive for renewable energy. Since 2003, to promote solar energy deployment by corporates and households, the Indian Ministry of Finance Department of Revenue offered a tax relief allowing corporates and investors to claim an 80% depreciation rebate on qualifying solar power plants. An additional depreciation of 20% of actual costs could be claimed in the first year of the new plant and solar machinery installment (e.g., solar power generation systems, solar pumps, solar water heaters) for the purpose of manufacturing. Hence, the asset owner could claim 100% depreciation in the first year. Key Enabling ConditionsThe accelerated depreciation scheme, along with other dedicated policies, increased the financial incentive for the commercial sector to invest in solar projects. By targeting incentives for solar PV installation, the policy established a supportive environment for the adoption of solar technology. This approach contributed to the objectives set by the National Solar mission to drive down reliance on traditional energy sources and promote the widespread adoption of solar power in the commercial sector.Impact / OutcomesIndia experienced a significant decrease in solar installation costs from 2010 to 2022, achieving a solar levelized cost of electricity (LCOE) that was lower than that of fossil fuel based generation sources in 2018. The most substantial reduction in solar LCOE occurred during the period 2010-2016, attributed to the decline in module costs and improved module efficiencies. The accelerated depreciation benefit did not have the intention to reduce solar module prices nor to foster solar module efficiencies. However, the measure could have indirectly accelerated efficiency gains by accelerating solar installments and increasing the scale and ecosystem for installation. Despite significant progress, overall solar energy capacity was slightly delayed versus the original 2022 target of 100 GW, with 70.1 GW installed as of June 2023. However, an additional 55.6 GW was already under construction, meaning India was well positioned to reach its deployment objectives thanks, in part, to the accelerated depreciation incentive. Some research also believe that the earlier discounting of accelerated, started in 2013, depreciation for wind turbines partially explains the sector's decline relative to solar.Additional Sourceshttps://www.eai.in/ref/ae/sol/cs/spi/kc/key_challenges_in_the_growth_of_solar_pv_technology_in_india.html https://economictimes.indiatimes.com/small-biz/productline/power-generation/how-india-in-a-short-period-of-time-has-become-the-cheapest-producer-of-solar-power/articleshow/70325301.cms?from=mdr https://economictimes.indiatimes.com/industry/renewables/india-achieves-70-10-gw-solar-energy-against-target-of-100gw-by-year-2022/articleshow/102175003.cms https://energy.economictimes.indiatimes.com/news/renewable/what-explains-the-steepest-dip-in-solar-installation-costs-in-india/103329903 https://www.iea.org/policies/4916-jawaharlal-nehru-national-solar-mission-phase-i-ii-and-iii https://www.india-briefing.com/news/accelerated-depreciation-solar-power-assets-31025.html/ https://www.novergysolar.com/accelerated-depreciation-benefit/#:~:text=st%20march%202017%20allowed%20to,installed%20for%20purpose%20of%20manufacturing
India
Accelerated Depreciation
Challenges to investmentIndia’s energy demand has surged since economic liberalization in the early 1990s. In 2015, India released its Nationally Determined Contribution under the Paris Agreement (updated in 2023), committing to reduce emissions intensity of its HDB by 45% and source 50% of power generation from non-fossil fuel sources by 2030. To meet this goal, India needed to promote private investment in renewable energy (RE). However, potential clean energy producers faced challenges enforcing contracts with their partners, given the lack of a comprehensive national framework to promote private RE investment, inadequate coordination among key institutions governing RE, volatile solar and wind tariffs, high credit risk in Power Purchase Agreements (PPAs), and the lack of standardized contracts.   ApproachIn the 2000s’s, the government of India (GoI) took progressive steps to improve contract enforcement, particularly in the electricity sector. The Electricity Act of 2003 was a key legislative framework which consolidated laws and policies for electricity generation, transmission, distribution, and trading. The Act introduced the Central Electricity Regulatory Commission (CERC) and State Electricity Regulatory Commissions (SERCs) as regulatory bodies. The CERC oversees inter-state electricity transmission and generation and formulated the National Electricity Policy in 2005, and the Tariff Policy in 2006. Meanwhile, the SERC determines state-level electricity tariffs and ensures compliance. The Act facilitates RE contracts through Section 86(1)(e) on generation and co-generation from renewable sources, Section 62 on determining tariffs for electricity services, and Section 42 on open access for electricity distribution. The Act also defines PPAs as contracts between a power buyer and a power producer at an agreed tariff, tenor and capacity. If the definition is not limited to renewable energy, it creates a clear transactional framework including both Utility PPAs, signed between RE producers and state-owned or private utilities, and corporate PPAs, signed between RE producers and private corporations.  Key Enabling ConditionsThe GoI’s commitment to RE contract enforcement was complemented by financial and regulatory support for RE contracts. These include Accelerated Depreciation (AD) for tax benefits for solar projects, Generation-Based Incentives (GBI) for wind energy, and Viability Gap Funding (VGF) for solar projects, ensuring fixed tariffs and funding up to 30% of project costs. The Insolvency and Bankruptcy Code (IBC), released in 2015, consolidated insolvency laws in India, and governs all companies, including government utilities. State-level mechanisms include Renewable Purchase Obligations (RPOs), which mandate bulk buyers to source a percentage of power from RE sources, driving demand for PPAs. Non-compliance requires purchase of Renewable Energy Certificates (RECs), traded nationally to meet RPOs. Impact / OutcomesA robust policy framework for enforcement of RE contracts increased investor confidence and helped advance clean energy investment, with the share of modern renewables in final energy consumption rising 50% from 2000 to 2020. As of February 2024, India ranked fourth globally in renewable installed capacity, with RE comprising approximately 43% of the power capacity mix in fiscal year (FY) 2023-24. In 2019 for example, corporate renewable PPAs added 1.4GW of capacity. For example, Idea purchased 6,576 MWh of solar power PPAs in FY 2018, saving 5,392 tons of CO2 emissions. Godrej, sourcing over 51% of its energy through renewables, reduced its GHG emissions by 42% since 2011, with its Godrej Tyson Food plant procuring 100% of its power through solar and wind PPAs.Additional SourcesNational Institution for Transforming India. (2024). Renewable Energy Resource Adequacy Planning to meet RPO by the States in India. https://www.niti.gov.in/sites/default/files/2024-02/Policy%20Paper_Energy_12022024_V4.pdfWorld Business Council for Sustainable Development. (2023). Corporate Renewable PPAs in India, https://www.wbcsd.org/wp-content/uploads/2023/12/WBCSD_PPA_India.pdfCentral Electricity Regulatory Commission. (2003). The Electricity Act, 2003 with amendments. https://www.cercind.gov.in/Act-with-amendment.pdfhttps://www.reuters.com/world/india/india-spend-up-385-bln-meet-renewable-energy-target-moodys-ratings-estimates-2024-06-06/https://www.mondaq.com/india/renewables/1254524/the-continued-rise-of-renewable-corporate-ppas-in-indiahttps://ijpiel.com/wp-content/uploads/2022/10/Regulators-and-Regulation-under-the-Electricity-Act-2003.pdfhttps://www.wbcsd.org/resources/accelerating-corporate-procurement-of-renewable-energy-in-india/https://cercind.gov.in/Function.htmlNational Electricity Policy | Government of India | Ministry of Power (powermin.gov.in)https://www.iea.org/countries/indiahttps://pib.gov.in/PressReleaseIframePage.aspx?PRID=1987752
India
Contract Enforcement for Clean Energy Products and Their Partners
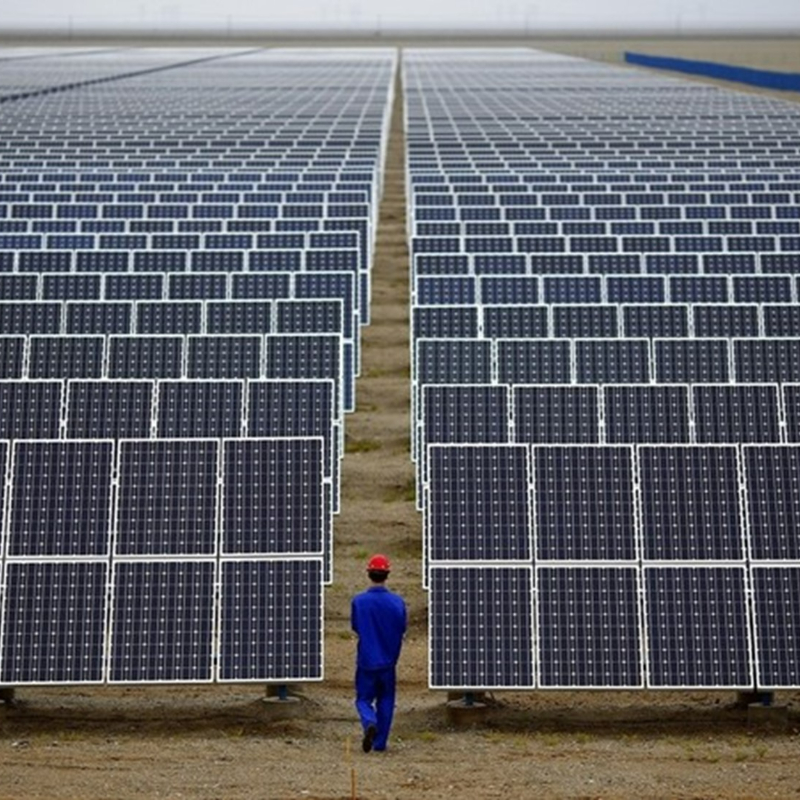
Challenges to investment Before India introduced competition into the power sector, customers were compelled to purchase electricity exclusively from State Electricity Distribution Companies (DISCOMs). This structure prevented competitive pricing. The Indian government sought to promote competition, drive operational efficiency, and open the market to private producers with a power market reform. By allowing independent power producers (IPPs) to enter the market, India aimed to attract private investment, particularly in renewable and alternative energy sources. This shift aimed to diversify procurement options, especially for larger consumers, with the ability to source electricity directly from renewable energy developers. Approach Introduced in the Electricity Act of 2003, the concept of Open Access (OA) allowed large consumers with a minimum demand of 1 MW, mainly from Commerce and Industries (C&I), to procure power directly from renewable energy generators, bypassing the state-owned distribution companies (DISCOMs). The OA secured non-discriminatory access to the transmission and distribution infrastructure. Two models were implemented in parallel: A third-party model, in which an IPP owned and operated the generation plant. A cross-subsidy surcharge (CSS) was introduced to support lower electricity tariffs for agricultural and residential consumers. A captive model, in which a C&I customer owned at least 26% of the plant and used at least 51% of the electricity it generated. Initially, Open Access faced challenges that hindered its full potential. In several states, DISCOMs offset revenue losses from C&I customers by increasing the cross-subsidy surcharges (CSS) and imposing unpredictable additional surcharges (AS), particularly affecting the third-party model. Bureaucratic delays in project approvals and inconsistencies in state-level regulations also created an uncertain climate for investors.To eliminate investment barriers and streamline processes, the Indian government introduced the Green Energy Open Access (GEA) Rules in 2022. These rules lowered the eligibility limit for open access consumers from 1 MW to 100 kW, thereby expanding access to small and medium-sized enterprises. Additionally, the GEA Rules clarified the use of various charges, including Additional Surcharge (AS) and the Cross Subsidy Surcharge (CSS) which were capped for increase at maximum 50% over 12 years, thereby improving long-term cost certainty for C&I customers. Specific surcharge exemptions were introduced for Waste-to-Energy plants, encouraging investment in diverse forms of renewable energy. The reform also ensured that renewable energy consumed beyond a consumer's Renewable Purchase Obligation (RPO) would count towards the DISCOM's RPO targets, creating an additional incentive for both consumers and power distributors. Lastly, the GEA Rules mandated the creation of a centralized nodal agency to manage applications and streamline approvals for OA consumers, therefore reducing delays. Key Enabling Conditions Several key factors have driven the success of Open Access. The liberalization of the electricity market, by enabling private players to participate in energy generation and supply, laid the groundwork for OA’s expansion. The government’s strong policy support for renewable energy, aimed at promoting sustainability, further reinforced OA as a mechanism to achieve corporate decarbonization goals while contributing to national clean energy targets. Increased awareness and demand from C&I customers who sought diversified and renewable energy options for both cost savings and environmental stewardship was also a critical driver of growth. Lastly, the geographic advantage of renewable energy resources, including wind in southern states and solar power in western and northern regions, enabled consumers to diversify their energy portfolios, further promoting the growth of OA.Impact / OutcomesFrom 2003 to 2017, India installed 2.3 GW of Open Access renewable energy (OA RE) capacity. This growth accelerated significantly between 2017 and 2022, with an additional 7.4 GW installed. Following the 2022 reforms, India achieved a record 3.2 GW of solar OA RE capacity in 2023. Overall, Open Access accounted for the largest share of estimated C&I renewable energy volume, more than double that of rooftop solar, the second-largest source.Open Access was especially successful in states with high energy demand and substantial industrial activity, such as Tamil Nadu, Karnataka, and Maharashtra, which, together, represent approximately 70% of the country’s OA RE capacity.Additional SourcesJMK, Institute for Energy Economics and Financial Analysis, India’s Renewable Energy Open Access Market: Trends and Outlook, August 2022, https://jmkresearch.com/wp-content/uploads/2022/08/India-Renewable-Energy-Open-Access-Market.pdfhttps://economictimes.indiatimes.com/industry/renewables/open-access-solar-capacity-addition-at-record-3-2-gw-in-2023-report/articleshow/108348935.cms?from=mdrFICCI, Facilitating Growth of Corporate Renewable Market, May 2023, https://ficci.in/api/pdf1/EMP?fileID=23786&fileName=Report-Corporate_RE_Market.pdf
India
RE Open Access to IPPs
Challenges to InvestmentBefore Brazil undertook power sector reforms in 1995, the sector was under state control with a vertically integrated structure, preventing private participation and market pricing. Power generation companies – owned by either the federal government or the individual states – operated Brazil’s transmission systems and embedded transmission costs in power sold to distributors. Distributors would push back on any increased costs from new transmission projects and power generators were not otherwise incentivized to invest in transmission projects. As a result, the transmission system suffered from chronic underinvestment, which resulted in poor service quality and insufficient infrastructure to satisfy demand.  ApproachIn 1995, Brazil undertook a series of reforms to boost the performance, efficiency, and capacity of the power sector by unbundling the generation, transmission, distribution and trading activities. For transmission in particular, the reforms established the principle of equal access, permitting independent transmission players to freely access generation and compete to offer transmission services. To facilitate private investment in transmission, the reforms created a framework for power market concessions and permissions for tendering transmission services, awarded through a competitive process. Under Law Nº 9,427/1996, Brazil established the Energy Regulatory Agency (Agência Nacional de Energia Elétrica; ANEEL), which took over responsibility for tendering transmission projects from the Ministry of Mines and Energy (MME). ANEEL evaluated the bids through a one-stage reverse bidding process and the award was subject to a price cap, based on a benchmark maximum annual revenue. A thirty-year BOOT contract (Build-Own-Operate-Transfer contract) was awarded to the bidder proposing the lowest annual revenue, equivalent to the lowest transmission tariff. The awarded company received the annual revenue in monthly payments for the entire contract term, with the price defined in Brazilian reais and annually adjusted for inflation.  Key Enabling ConditionsSeveral related reforms enabled the proliferation of transmission projects and companies in Brazil. First, the reforms established the National System Operator (ONS), which provided ongoing power sector coordination from the design phase to system operations. Second, ANEEL offered multiple concession structures, increasing the ability of existing and new players to launch new transmission projects. Last, transmission companies that had experienced delays in previous tenders could not participate in future tenders for a certain period, reducing the impact of defaults on overall energy supply.Impact / OutcomesFrom 1999 to January 2017, ANEEL conducted 38 auctions for multiple lots, awarding 211 transmission line concessions of over 69,811 km in total length. The use of competitive tendering in these auctions helped to reduce costs, with the discount on winning bids averaging 22.8% of ANEEL's estimated annual revenue (based on tenders awarded from 2000-2015). The capital mobilized for transmission expansion projects amounted to $15.9 billion. Of that investment, the private sector accounted for almost 70% of investments in transmission between 2000 and 2010, with 30% coming from foreign companies and 39% from local private companies, while the remaining investments were made by federal and state-owned companies. Between 2005 and 2009, all tenders were successful, but it is worth noting that from 2012 to 2015, 37% of the lots tendered were unsuccessful due to overestimation of the benchmark annual revenue, delays in the issuance of environmental permits, and relatively tight financial conditions.Additional SourcesESMAP (2012). International Experience with Private Sector Participation in Power Grids: Brazil Case Study, https://openknowledge.worldbank.org/server/api/core/bitstreams/b8aa4612-6c11-5148-b0f0-09d187fe5081/content ESMAP (2015). Private Sector Participation in Electricity Transmission and Distribution, https://documents1.worldbank.org/curated/en/786091468189572248/pdf/99009-ESMAP-P146042-PUBLIC-Box393185B.pdf Tolmasquim, M. T., de Barros Correia, T., Porto, N. A., & Kruger, W. (2021). Electricity market design and renewable energy auctions: The case of Brazil. Energy Policy, 158, 112558, https://doi.org/10.1016/j.enpol.2021.112558. WBG (2017). Linking Up: Public-Private Partnerships in Power Transmission in Africa, https://openknowledge.worldbank.org/server/api/core/bitstreams/2aa0efdd-f47f-5f9c-b8a6-042e891b2c2c/content https://www.financierworldwide.com/expansion-of-the-brazilian-power-trade-market-impacts-and-opportunities-for-foreign-investment https://www.iea.org/reports/brazil-case-study/grids-in-brazil-mobilising-private-capital-through-a-robust-regulatory-framework
Brazil
Openness of Grid to Private Investment
Challenges to investment In the 1980’s, Mexico experienced a complex macroeconomic and socio-economic transformation, triggered partially by the 1982 debt crisis and a period of high inflation between 1982 and 1987, jumping from 61.8% annual rate of inflation in 1982 to a record high of 142.8% by 1987. As a response to these challenges, a set of policy reforms were implemented to, not only stabilize the government financial situation, but also integrate Mexico into the world economy. Back then, electricity was perceived as a drain for the government state budget. The introduction of energy efficiency standards was proposed as a solution to respond to energy affordability issues and bolster the country’s energy security. Approach In 1989, Mexico founded the National Commission on Energy Savings (CONAE) to establish a program of minimum energy performance standards, “Normas Oficiales Mexicanas” (NOMs).The first four standards, promulgated in 1994, covered three important household appliances—water pumps, gas heaters, and refrigerators—as well as three-phase electric motors, which impacted multiple industries and sub-sectors. This first set of NOMs was based on standards for the same products already implemented in the United States by that time. In fact, the standards intentionally matched both the measurement specifications for rating energy efficiency and level of stringency. Since then, CONAE’s successor, the National Commission for the Efficient Use of Energy (CONUEE), further expanded the appliance efficiency standards program to 33 NOMs, with specifications and mandatory minimum energy performance levels for each appliance type, equipment, or systems. Some of the categories covered include water pumps, transformers, water heaters, AC, washers, refrigerator, freezers, residential lighting fixtures, road and exterior lighting, construction equipment, stoves, chargers and power supply, audio and video systems, as well as electric engines. Key Enabling Conditions Strong consumers acceptance and ensuing energy efficiency benefits to communities (lower electricity bills) improved the demand for efficient products.The ability to comply with requirements of key strategic trade partners in the regions (North America), resulted on additional benefits beyond the initial goal, which enabled a rapid adaptation and steady compliance on MEPS certification and assurance.Lastly, the evolution of the MEPS standards and update to existing NOMS led CONUEE to play a more important role in the energy transition ecosystem. Impact / OutcomesFor Mexico, these policies have had multiple benefits, from energy savings to economic benefits for consumers, increasing access to energy services. They are reported to have had positive fiscal impacts while providing a competitive edge to Mexico’s industrial sector.When introduced to the Mexican market, standards for refrigerators alone were said to have reduced the energy consumption of the product class by 26%. A study later published by the Government of Mexico found that the first update to the refrigerator and air conditioner standards from the early 2000s saved approximately 6 TWh for the year 2014.In a period of economic integration among the countries of North America, this alignment in MEPS minimized barriers to the import and export of domestic appliances and industrial equipment. Trade advantages resulted, as seen with the example of refrigerators, which exports from Mexico to the US in the period 2000 – 2014 saw 9-fold increase to about USD 3.7 billion. Additional SourcesCONUEE. Normas Oficiales Mexicanas de Eficiencia Energética. Balance 2023. (In Spanish) BALANCE_NOM-ENER_2023.pdf (www.gob.mx) Conuee website. https://www.gob.mx/conuee Enerdata. Empowering Sustainable Development Through Energy Efficiency. 2023. https://www.enerdata.net/publications/executive-briefing/latin-america-energy-efficiency.html North American Energy Working Group (NAEWG). North American Energy Efficiency Standards and Labeling https://www.energy.gov/eere/buildings/articles/north-america-energy-efficiency-standards-and-labelingSamuel A. Martínez-Montejo, Claudia Sheinbaum-Pardo, The impact of energy efficiency standards on residential electricity consumption in Mexico, Energy for Sustainable Development, 2016. https://www.sciencedirect.com/science/article/abs/pii/S0973082616300473 Impacts Evaluation of Appliance Energy Efficiency Standards in Mexico since 2000 Technical Report. https://www.gob.mx/cms/uploads/attachment/file/98119/EvaluaciondeimpactosdelasnormasdeeficienciaenergeticaenMexicodesde_elaioo2000.pdfCollaborative Labeling and Appliance Standards Program (CLASP) Minimum Efficiency Performance Standards, Labels, and Test Procedures for Refrigerators, Freezers, and Room Air Conditioners in Canada, México, the United States, China, and Other Developing and Transition Nations, Howard Geller, 2006. https://www.clasp.ngo/research/all/minimum-efficiency-performance-standards-labels-and-test-procedures-for-refrigerators-freezers-and-room-air-conditioners-in-canada-mexico-the-united-states-china-and-other-developing-and-transition-na/?success=1U4E (United for Efficiency), UN, Country Savings Assessment, Mexico. https://united4efficiency.org/wp-content/uploads/2022/08/MEX_U4E-Country-Saving-Assessment_Jul-22.pdfIEA. Energy System Mexico. https://www.iea.org/countries/mexico IEA Policies Database. MEPS in Mexico. https://www.iea.org/policies?topic=Buildings&type=Minimum%20Energy%20Performance%20Standards%20%28MEPS%29&country%5B0%5D=MexicoUniversity of Chicago. Working Paper. The Case Mexico. Meza, 2019. https://bfi.uchicago.edu/wp-content/uploads/The-Case-of-Mexico.pdf Harvard Business School, 717-027 Mexico’s Energy Reform. Vietor et.al., 2017. https://hepg.hks.harvard.edu/files/hepg/files/mexican_energy_reform_draft_1.23.pdf USAID. Energy Efficiency for Development Program (EE4D). Success Story: Air Conditioning Electricity Monitoring in Sonora, Mexico. Success Story: Air Conditioning Electricity Monitoring in Sonora, Mexico (usaid.gov) https://www.researchgate.net/publication/228405323_The_Mexican_Electricity_Sector_Economic_Legal_and_Political_Issues 
Mexico
Minimum Energy Performance Standards

Playbook of Solutions

A World Economic Forum Initiative
About Policy Measures De-risking Tools Finance Mechanisms Case Studies Get Involved
© 2026 All rights reserved
Privacy Policy & Terms of Service