Playbook of Solutions

Home
About
Policy Measures
De-risking Tools
Finance Mechanisms
Case Studies
Get Involved

Case Studies

The Playbook of Solutions is an interactive online tool, referencing concrete, already implemented policy measures, de-risking tools and finance mechanisms that have successfully helped unlock finance for clean energy in the Global South. 

Show more
Challenges to investment Ecuador’s Constitution of 2008 explicitly stated that the government would promote the use of clean and alternative energy sources. In this context, Ecuador’s National Plan for Good Living 2009-2013 set a target of 6% renewable energy (RE) installed capacity by 2013, excluding large hydro. The subsequent National Plan for Good Living 2013-2022 updated the sourcing target to 60% of RE generation capacity by 2017, emphasizing hydropower and bioenergy. To achieve this goal, the Government of Ecuador needed to financially incentivize the deployment of RE and ensure transmission capacity for electricity generated by RE, which could be located far from existing transmission lines posing a challenge to their grid integration.  Approach Under the Electricity Law of 1996, Ecuador implemented a feed-in tariff (FiT) system from 2000 to 2015 to support RE deployment. The FiT system evolved over time in terms of duration, rates, and included technologies, with FiT contracts awarded for a period of 15 years. A critical component of the FiT policy was the priority dispatch ruling, which determined how power generators connected to the grid. Priority dispatch ensured RE generators were dispatched ahead of non-renewable ones, reducing the risk of not securing transmission capacity. The responsible National Electricity Council (CONELEC) advanced RE through the dispatch regulation. Specifically, in 2004 (Regulation CONELEC 004/04) and 2006 (Regulation CONELEC 009/06), FiT regulations mandated preferential dispatch for renewables until RE generation reached 2% of the total electric system's generation capacity, after which new generators dispatched on economic value. In 2008, Regulation CONELEC 013/08 established preferential dispatch for renewable electricity up to 6% of the system's installed capacity. In 2012, Regulation CONELEC 102/12 exempted hydro, biomass, and geothermal (dispatchable technologies) from the preferential dispatch limit. The FiT regulations from 2002, 2004, and 2006 mandated additional compensation for project developers who built transmission lines to connect RE projects to the grid paying an additional USD 0.06 cents/kWh/km, with a maximum cost of USD 1.5 cents/kWh. Key Enabling Conditions Since 2011, RE projects receiving the FiT had to contribute a specified amount per kWh generated to social and community development projects fostering social acceptance. Other initiatives, such as the Galapagos Island Zero Fossil Fuels initiative, spurred and accelerated RE deployment with projects displacing oil-based electricity generation. This initiative led to the development of two wind farms, two photovoltaic (PV) projects, and two hybrid PV-biofuel-battery projects with assistance from the UNDP, Korea (KOICA), Japan (JICS), and Germany (KfW).  Impact / Outcomes Preferential dispatch helped increase RE access to transmission lines, driving in part an increase in wind energy in Ecuador from 3 GWh in 2010 to 73 GWh in 2017. Similarly, solar electricity generation grew from 4 GWh in 2013 to 35 GWh in 2017. Despite these increases, both sources only contributed 0.26% of total generation in 2013 and 0.39% in 2017, falling short of the targeted 6% in 2013. However, Ecuador’s RE capacity took of later on, achieving the 60% RE generation target in 2017 due to large hydro capacity, which accounted for over 71% of total electricity generation. The FiT and its preferential dispatch component are no longer available in Ecuador since 31 December 2016 but have helped jumpstart the RE industry in the country. Additional SourcesGME (2022). Ecuadorean Power Sector: Regulatory framework and Power Market Outlook, https://gme-global.com/uploads/archivos/20220112-122239.pdf IRENA (2015), Renewable Energy Policy Brief: Ecuador; IRENA, Abu Dhabi, https://www.irena.org/-/media/Files/IRENA/Agency/Publication/2015/IRENA_RE_Latin_America_Policies/IRENA_RE_Latin_America_Policies_2015_Country_Ecuador.pdf?la=en&hash=C1F46A560D0E8FF6655216BC36410A6D41B98B21 Jacobs, D., Marzolf, N., Paredes, J. R., Rickerson, W., Flynn, H., Becker-Birck, C., & Solano-Peralta, M. (2013). Analysis of renewable energy incentives in the Latin America and Caribbean region: The feed-in tariff case. Energy Policy, 60, 601-610, https://www.researchgate.net/profile/Juan-Paredes-17/publication/271893107_Analysis_of_renewable_energy_incentives_in_the_Latin_America_and_Caribbean_region_The_feed-in_tariff_case/links/5aa70272a6fdcccdc46a8d59/Analysis-of-renewable-energy-incentives-in-the-Latin-America-and-Caribbean-region-The-feed-in-tariff-case.pdf USAID (2020). Ecuador Energy Sector Assessment, https://pdf.usaid.gov/pdf_docs/PA00WQNF.pdf https://www.iea.org/policies/5459-ecuador-feed-in-tariff-for-renewable-energy-regulacion-para-la-participacion-de-los-generadores-de-energia-electrica-producida-con-recursos-energeticos-renovables-no-convencionales-no-conelec-00113 https://www.kfw-entwicklungsbank.de/SDG-portal/SDG-13/Hybridkraftwerke-Galapagos/ https://www.nortonrosefulbright.com/en/knowledge/publications/e9fe5e64/renewable-energy-in-latin-america-ecuador https://www.trackingstandard.org/wp-content/uploads/I-REC-Country-Assessment-Ecuador-03Jan2022.pdf
Ecuador
Preferential Access to Grid for RE
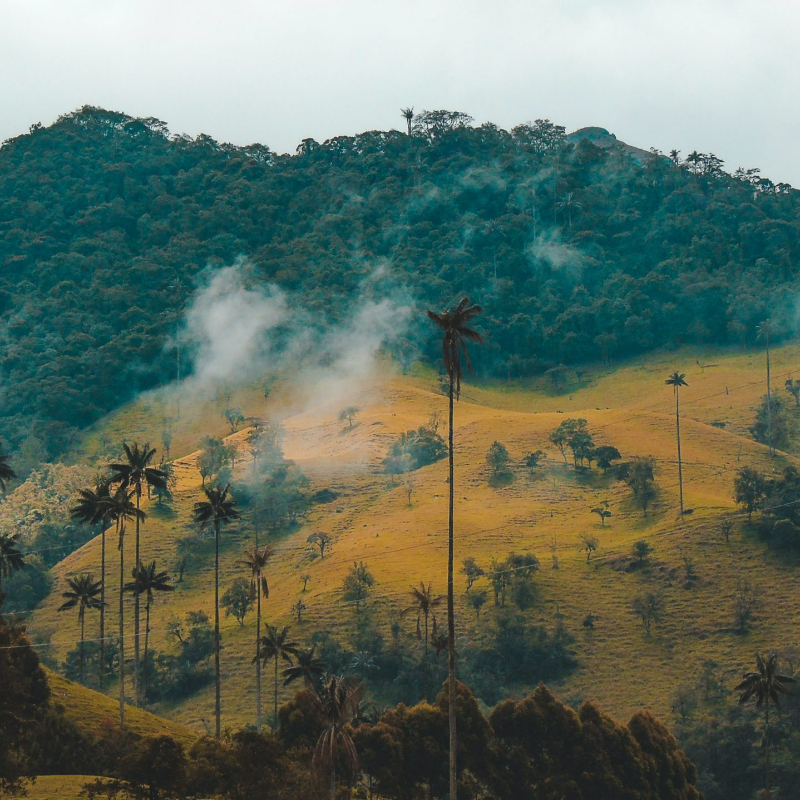
Challenges to investment In Colombia's strategic plan to fulfill its climate commitments under the Paris Agreement, the nation aimed to reduce its greenhouse gas (GHG) emissions by approximately 90% by 2050, relative to the levels recorded in 2015. Additionally, Colombia would also need to offset the remaining 10% through proportional national removals to achieve a net zero balance (reducing GHG emissions by 100%) from 2050 onwards. To achieve its net zero goal, Colombia needed an economic and financial tool incentivizing emission avoidance, potentially through renewable energy (RE) generation.   Approach In 2016, Law 1819 established the National Carbon Tax in Colombia as part of a broad tax reform package, with the tax coming into force on1 January 2017. This upstream tax applied to producers of fossil fuels for the domestic market and direct importers of fossil fuels, excluding coal and domestic use of natural gas. Specifically, the tax covered fuels such as gasoline, kerosene, diesel, fuel oil, industrial usage of natural gas for refining hydrocarbons and petrochemicals, and industrial liquefied petroleum gas. Initially, the tax targeted 24% of total GHG emissions (resulting from the covered fuels) at this time and was levied by producers and importers. Under the law's initial plan, revenues from the tax would be channeled to the Sustainable Colombia Fund, which is earmarked for initiatives like combating coastal erosion, preserving water sources, and protecting ecosystems. Moreover, one crucial aspect of the carbon tax was the promotion of RE, especially wind and hydroelectric power as thedeployment of these technologies would lead to reduce carbon dioxide emissions (CO2e).  Key Enabling Conditions The introduction and implementation of the carbon tax in Colombia partly contributed to catalyse the country's nomination to the Organisation for Economic Cooperation and Development (OECD) and eligibility for various sustainable financing initiatives. For instance, around 5% of the carbon tax revenues were directed towards programmes such as the Heritage Colombia programme, which aimed to protect and conserve 20 million hectares of Colombia's natural areas. Finally, the United States Agency for International Development (USAID) supported Colombia’s sustainable development and climate priorities through several programs for instance designing RE auctions. Impact / Outcomes The carbon tax rate commenced at USD 5 per ton of CO2e, with an annual increase of 1% plus inflation until reaching USD 10. In 2017, revenues amounted to USD 159 million, followed by USD 98 million in 2018 and USD 95 million until July 2019. Initially, these revenues were directed to the Sustainable Colombia Fund, which was later renamed into the Colombia Peace Fund after the peace agreement in 2016. By 2021, the carbon tax covered 19.4% of total GHG emissions in CO2e caused by targeted fuels. The electricity generation from wind increased substantially from 2017 with 3 GWh to 60 GWh in 2022, while hydroelectricity generation remained on the same level over these years with around 61,000 GWh. Additional SourcesCarbon Trust, Environmental Defense Fund (EDF), and IETA. (2018). Colombia: An Emissions Trading Case Study, https://www.edf.org/sites/default/files/colombia-case-study-2018.pdf Giovanni, E., Khalid, F., Richards, K. (2022). Case Study: Carbon Tax in Colombia, https://gnarlytreesustainability.com/wp-content/uploads/2022/07/Case-5_Colombia.pdf Mogollon, J.(2019). Carbon Tax in Colombia. Presentation for the Ministry of Finance Colombia, https://www.financeministersforclimate.org/sites/cape/files/inline-files/Carbon%20Tax%20in%20Colombia.pdf USAID (2023). Colombia: Climate Change Fact Sheet, https://www.usaid.gov/sites/default/files/2023-03/2022-USAID-Colombia-Climate-Change-Country-Profile.pdf World Bank (2020). Expanding Carbon Pricing in Colombia: Final report for the Partnership for Market Readiness Project, https://documents1.worldbank.org/curated/en/559731608060479169/pdf/Expanding-Carbon-Pricing-in-Colombia-Final-Report-for-the-Partnership-for-Market-Readiness-Project.pdf https://www.conservationfinancenetwork.org/2018/11/27/colombia-puts-tax-on-carbonhttps://www.efdinitiative.org/story/carbon-pricing-policy-tool-sustainable-growth-2019 https://www.giz.de/en/worldwide/59496.html IEA (2023), Energy Statistics Data Browser, IEA, Paris https://www.iea.org/data-and-statistics/data-tools/energy-statistics-data-browser https://www.oecd.org/tax/tax-policy/carbon-pricing-colombia.pdfhttps://www.usaid.gov/energy/auctions/colombia-case-study-irena
Colombia
Carbon Taxes
Challenges to investmentDuring Ghana’s energy crisis in 2011-2016, Ghana’s government signed 43 power purchase agreements (PPAs), in hopes of resolving electricity shortages. However, as the new government began its term in 2017, it found that these PPA contracts exceeded the country's power needs. As excess capacity rose, the Ministry of Finance was forced to pay for the unused electricity, amounting to over $600 million by 2019. Despite previous debt relief, Ghana struggled with about $30 billion in external debt, including USD 2.7 billion tied to the energy sector which had the potential to reach USD 12 billion by 2030 if left unaddressed. The fiscal burden prompted the government to terminate numerous contracts and seek renegotiations. Beyond contract renegotiation, however, the government still had to develop a more accountable approach to PPA contracting, in order to resolve transparency issues which had caused the overcapacity, weakened sector planning, and increased fiscal deficits. ApproachGhana’s utility regulator, the Public Utilities Regulatory Commission (PURC), launched a public register of PPAs to share information on all Ghana’s active electricity contracts, encompassing both renewable and non-renewable power projects. The registry’s details closely aligned with recommendations developed by the Energy for Growth Hub and the Institute of Economic Affairs (IEA) Ghana. The public PPA register aimed to enhance transparency, generate market competition, improve planning, and provide governance for the electricity sector. Key Enabling ConditionsTo complement the efforts to increase transparency with the public PPA register, the Ghanaian government undertook additional measures to enhance transparency of future PPAs, including the introduction of competitive tendering procedures. To implement these new tenders, the government leveraged resources from the Energy Sector Recovery Programme (ESRP) and the World Bank-supported Energy Sector Transformation Initiative Project (GESTIP). The Ministry of Energy also formulated a Policy Guidance for Least Cost Fuel Procurement and a Policy for Competitive Procurement of Energy Supply and Services Contracts. These policies required electricity procurement to synchronize with government demand and supply projections, while also ensuring that capacity additions were subject to open competition.Impact / OutcomesThe public PPA register encompassed 14 energy projects (most being signed in 2016), including 11 non-renewable energy projects and 3 renewable energy projects. Two of the RE projects were solar photovoltaic projects in Winneba (signed in June 2013 and December 2015) generating a combined 40 MW capacity. The register launch upgraded Ghana’s ranking in terms of transparency according to PPA Watch, an initiative of the Energy for Growth Hub. Ghana continues to evaluate the programme and experts have assessed three possible improvements for the next version of the register: (i) the Ghanaian parliament could improve oversight and pass laws to require disclosure of PPAs of public interest, (ii) the Ministry of Energy could publish all future electricity contracts within a year of the completion of the financing, and (iii) the Ministry of Finance could mandate that any future PPA with a government guarantee be publicly announced.Additional SourcesAckah, I., Auth, K., Kwakye, J., Moss, T. (2021). A Case Study of Ghana’s Power Purchase Agreements, https://energyforgrowth.org/wp-content/uploads/2021/03/A-Case-Study-of-Ghanas-Power-Purchase-Agreements.pdf https://energyforgrowth.org/article/the-latest-power-supply-challenges-in-ghana/https://energyforgrowth.org/press/the-other-hidden-debt-how-power-contract-transparency-can-help-prevent-future-debt-risk/https://energyforgrowth.org/project/contract-transparency/https://energyforgrowth.org/wp-content/uploads/2021/03/Ghana-PPAs-Annex-Table-3.pdfhttps://enveurope.springeropen.com/articles/10.1186/s12302-023-00732-5
Ghana
One-Stop-Shops for Property Registration
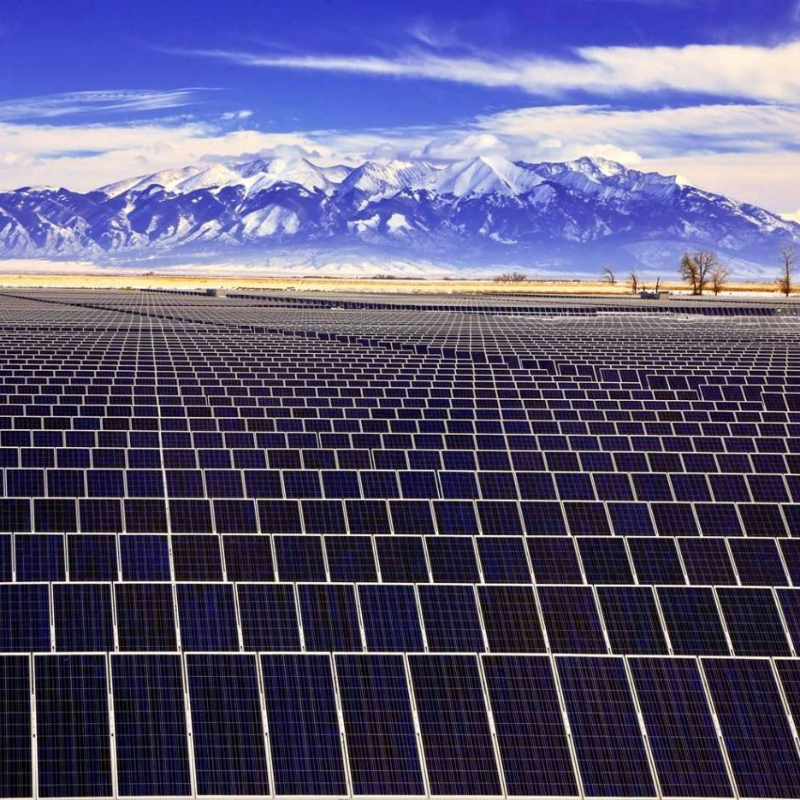
Challenges to investment In 2015, the Ministry of Energy established Chile’s Long-Term Energy Planning (PELP) to project the country’s energy future in a 30-year horizon through the definition of long-term scenarios. The PELP established a pioneering goal of 70% renewable energy generation by 2050. To reach this goal, Chile required a comprehensive and proactive approach to planning electricity transmission infrastructure, beyond simply mitigating planning uncertainty. Chile’s power system would need to incorporate non-conventional renewable energy (NCRE) and periodically review the transmission grid to effectively respond to changing demand. The new policy would also need to foster a modern, robust, and flexible transmission infrastructure network, given NCRE generation was location-specific and generators paid most of the transmission costs. Approach Chile’s Transmission Law (Law 20.936), enacted on 6 July 2016, aimed to enhance the role of the state in energy planning, transmission system expansion and renewable energy promotion. Among other measures, the law mandated non-discriminatory open access to the transmission grid and shifted the transmission grid costs from generators to customers. As a result, renewable developers could choose areas for NCRE generation that were resource-rich but more distant, enhancing competitiveness for renewable generation. Under the law, small NCRE generators were entirely exempted from transmission toll payments, given their minimal effects on transmission grids. In addition to mandating open access, the law also unified Chile's northern and central/southern power grids; created an independent unified system operator, the National Electricity Coordinator (CEN); ensured that the Ministry of Energy develop a comprehensive energy plan every 5 years; and mandated National Energy Commission (CNE) to develop 20-year forecasts for generation planning. Key Enabling Conditions Chile’s 2016 Transmission Law incorporated a combination of centralized expansion planning and market mechanisms, including tenders for the supply of energy to regulated customers, quotas, and notably, auctions, to ensure efficient transmission investments and the entry of new transmission companies. By utilizing ex ante market competition, the payments for new installations were determined, mitigating potential tariff regulation issues. The participation of both the regulator and interested parties allowed for improved electricity generation and consumption forecasts through stakeholder inputs as well as social acceptance in civil society. Impact / Outcomes Benefitting in part from open access (but also from dedicated tax benefits, high power prices and efficient regulatory framework), the national power system saw a significant increase in NCRE contribution to overall generation. By the end of 2021, NCRE generation accounted for approximately 35% of the total generation, a substantial rise from less than 15% in early 2016. Increased NCRE generation also spurred increased investment in the transmission network, with 31 projects under construction as of May 2021, encompassing a total line length of 652 km and investment of $634 million. Of these projects, 64% were transmission line projects, while the remaining 36% were substation projects. As part of the 2020 expansion plan, a total of 46 grid projects were identified for launch by 2023, with an estimated investment of $511 million. By May 2021, the CEN was expected to initiate the tendering process for an additional 200 new transmission construction projects, with a total value of $3,200 million over the next five years.Additional SourcesFuentes, F., & Serra, P. (2022). Chilean electric transmission regulation: from a merchant approach to central planning. Energies, 15(12), 4336, https://www.mdpi.com/1996-1073/15/12/4336/pdf IEA (2018), Energy Policies Beyond IEA Countries: Chile, https://iea.blob.core.windows.net/assets/8c16efa0-41b1-47be-b12a-a29483a0c635/EnergyPoliciesBeyondIEACountriesChile2018Review.pdf Nasirov, S.; Silva, C.; Agostini, C.A. (2015), Investors’ Perspectives on Barriers to the Deployment of Renewable Energy Sources in Chile. Energies, 8, 3794-3814. https://doi.org/10.3390/en8053794 Nasirov, S., Agostini, C., Silva, C., & Caceres, G. (2018). Renewable energy transition: a market-driven solution for the energy and environmental concerns in Chile. Clean Technologies and Environmental Policy, 20, 3-12, https://ficpubs.uai.cl/files/823_Nasirov_etal2018.pdf Serra, P. (2022). Chile's electricity markets: Four decades on from their original design. Energy Strategy Reviews, 39, 100798, https://www.sciencedirect.com/science/article/pii/S2211467X21001814 Troncoso, S. L. (2022). The Chilean Case Improving Power Transmission within the Non-Conventional Renewable Energies Paradigm. Energy LJ, 43, 267, https://www.eba-net.org/wp-content/uploads/2023/01/4-Luengo267-297.pdf https://www.climateparl.net/post/2016/08/26/ley-de-transmisi%C3%B3n-en-chile https://energyandmines.com/2016/01/what-do-chiles-new-transmission-regulations-mean-for-mines-and-renewables/ https://reglobal.org/paving-way-for-renewable-integration-in-chile/ https://www.windpowermonthly.com/article/1401700/chile-approves-significant-transmission-law
Chile
Preferential Access to Grid for RE
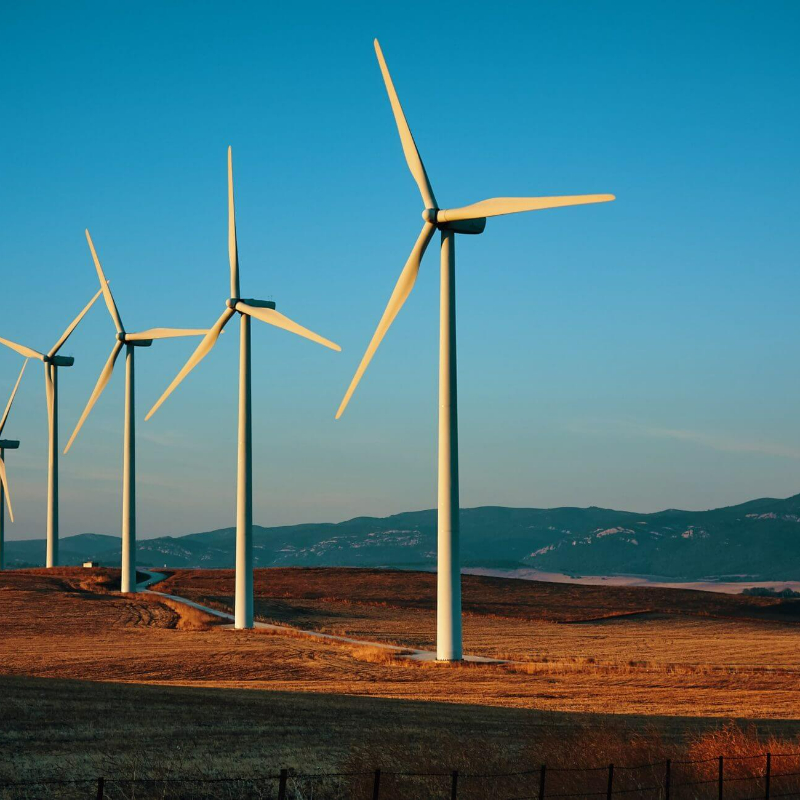
DescriptionA counterparty guarantee is a form of assurance provided by one party (the guarantor) to another party (the beneficiary) to perform the obligation of a third party if the third party fails to perform its obligation. Generally, counterparty guarantees are financial obligations that require the guarantor to make a payment on behalf of the guaranteed entity (e.g., service debt), but they can also require other compensation (e.g., termination payment) and cover operational obligations (e.g. supply of materials, construction). BenefitsCounterparty guarantees cover counterparty risk (i.e., risks arising from an entity’s – often the utility’s – poor credit quality). In project finance, counterparty guarantees facilitate the financing of projects that would otherwise be considered too risky. Such guarantees can increase investor confidence, broaden the pool of potential financiers, and improve financing terms by reducing costs, increasing available funds, and extending loan maturities. This in turn reduces the annual debt service costs for project users. Case StudyFund for the Development of Renewable Energy (FODER) guaranteeing Argentinian national utility’s payments Argentina's RenovAr initiative, launched in 2016, aimed to increase the share of renewable energy from 2% to 20% by 2025. It addressed financing and sector risks through mechanisms such as the Fund for the Development of Renewable Energy (FODER), which guaranteed payments from CAMMESA, the national utility. FODER ensured compliance with power purchase agreements (PPAs) and provided a counterparty guarantee in the form of a put option that could be exercised by Independent Power Producers (IPPs) if CAMMESA failed to pay for the contracted off-take. The World Bank Group (WBG) provided support to FODER, further enhancing investors’ confidence by reducing country risk. The innovative financial structure notably included a USD 480 million WBG termination guarantee, which was critical in mitigating political risks. Strong government support and collaboration with IFC ensured rapid implementation and attracted more bids than expected. RenovAr attracted over 2,400MW of projects, mainly wind and solar, through four successful tenders.However, economic crises, high inflation and the impact of COVID-19 hindered full target achievement with only 32.6% of the private capital mobilisation and 57% of the renewable energy capacity targets achieved by December 2021. Despite these setbacks, RenovAr's design effectively encouraged private investment, marking significant progress in Argentina's renewable energy sector, while demonstrating the importance of effective de-risking mechanisms. Additional SourcesS&P Global, Project Finance Construction And Operations Counterparty Methodology, 2011, https://maalot.co.il/Publications/MT20180214122842.PDFGlobal Infrastructure Facility, Government Guarantees for Mobilizing Private Investment in Infrastructure, 2019, https://ppp.worldbank.org/public-private-partnership/sites/ppp.worldbank.org/files/2020-02/Government-Guarantees%20for%20Mobilizing%20Private%20Investment%20in%20Infrastructure.pdfWorld Resources Institute, Mobilizing Private Investment in Climate Solutions: De-risking Strategies of Multilateral Development Banks, 2023, https://files.wri.org/d8/s3fs-public/2023-07/mobilizing-private-investment-climate-solutions.pdf?VersionId=eP7TinOgdXimK859xF2Flj_utYKachIThttps://www.energia.gob.ar/contenidos/verpagina.php?idpagina=4127
Argentina
Counterparty Guarantees
Challenges to InvestmentMadagascar faced several challenges in the development of clean energy infrastructure, particularly solar, as it traditionally relied on hydro and thermal generation. In 2015, only 23.8% of the population had access to electricity, complicated by low population density, and unfavourable demand patterns. The country lacked sufficient infrastructure for widespread distribution and storage of renewable energy, and new installations were at risk of climate events such as cyclones and flooding. Beyond technological constraints, political instability, limited institutional capacity and resources, and the lack of legal frameworks and standards for clean energy hindered investment. The government faced mounting pressure to meet its electrification goals under the Madagascar New Energy Policy 2015-2030, while also maintaining subsidies for the state utility company Jiro sy rano Malagasy (JIRAMA), which relied on expensive petroleum imports for generation.  ApproachThe government of Madagascar offered a series of fiscal incentives to promote clean energy in its 2015 budget. These incentives included a reduction in corporate income tax equivalent to 20% of the investment in renewable energy (up to 50% of total tax liable), reduction on VAT or import duties for renewable energy equipment, and accelerated depreciation rates of 30% for investment in renewable energy equipment. From 2004, the government had permitted a build-operate-transfer (BOT) model for mini-grid concessions, which it expanded to include solar mini-grids in 2015. This clean energy model was first applied in mid-2015, with further auctions planned for 2016 and 2017 to achieve rural electrification objectives. Key Enabling ConditionsThe success of these policies in promoting clean energy in Madagascar can be attributed to several key enabling conditions. The government's political strategy to increase access to electricity from 15% to 70% by 2030 provided clear direction, while fiscal incentives and the BOT model created a more favourable environment for investment. Additionally, the World Bank's assistance in restructuring Madagascar's national utility company, JIRAMA, improved electricity sector planning and financial sustainability.  Impact / OutcomesThe introduction of tax incentives and reductions, along with the BOT model for solar mini-grids, led to positive outcomes in terms of pre-electrification/electrification, renewable energy generation, and emissions. Private companies have confirmed that increasing solar PV for commercial, industrial, and residential purposes is a cost-effective way to reduce energy costs and ensure electricity supply stability. Additionally, these incentives helped create a market for pre-electrification solutions such as solar lamps, especially in rural areas. Access to electricity has increased from 23.5% in 2015 to 35.1% in 2021. Renewables’ share of Total Energy Supply increased by 4% from 2015 to 2020, while Madagascar’s use of imported energy fell 4% over the same period. Solar now represents 56 GWh or 3% of total generation capacity, with mini-grids spearheaded by civil society organisations and microfinance institutions (e.g., Access Bank Madagascar). These interventions also activated support from the World Bank (USD 65 and USD 40 million in 2016 and 2018, respectively) to improve electricity sector operations and governance and from the IFC’s Scaling Solar program in 2016, catalysing investment in a 25 MW solar plant.Additional Sourceshttps://fsr.eui.eu/how-are-islands-promoting-and-integrating-renewables/https://www.elibrary.imf.org/view/journals/002/2022/342/article-A001-en.xmlInternational Energy Agency, “Energy Statistics Data Browser: Egypt”, 21 December 2023, https://www.iea.org/data-and-statistics/data-tools/energy-statistics-data-browser?country=WORLD&fuel=Energy%20supply&indicator=TESbySourcehttps://www.iea.org/countries/madagascar/electricityInternational Renewable Energy Agency, “Energy Profile: Madagascar (2023)”, https://www.irena.org/-/media/Files/IRENA/Agency/Statistics/Statistical_Profiles/Africa/Madagascar_Africa_RE_SP.pdfhttps://taxsummaries.pwc.com/madagascar/corporate/tax-credits-and-incentiveshttps://documents1.worldbank.org/curated/pt/662401556935396537/pdf/Madagascar-Fiscal-Sustainability-and-Energy-Development-Policy-Financing-Project.pdfhttps://www.worldbank.org/en/news/feature/2018/10/10/the-force-of-the-sun-madagascar-embarks-on-renewable-energy-productionhttps://pressroom.ifc.org/all/pages/PressDetail.aspx?ID=18071
Madagascar
Renewables Tax Relief
Challenges to investment In 2015-16, the power sector in Zambia – characterized by 90% hydropower electricity production – experienced power supply shortages due to low rainfall and drought. After being forced to import expensive energy, the Government of the Republic of Zambia (GRZ) was motivated to increase its power generation capacity and diversify the energy mix. In particular, the GRZ hoped that solar generation could resolve some the nation’s energy challenges but faced several challenges to installation. Zambia’s electricity market was limited in scale and controlled by the state-owned utility, which retained its monopoly despite being financially distressed. Potential solar investors also faced delays and uncertainties in the procurement process and lacked stable institutional or regulatory support. As a result, solar PV projects risked potential non-payment of electricity bills or insufficient tariffs to cover investment and operating costs.   Approach In August 2015, GRZ leveraged the International Finance Corporation’s (IFC) “Scaling Solar” programme to tender two solar PV plants with a combined capacity of up to 100 MW. The "Scaling Solar" programme was initiated by the IFC in 2015, with the aim of facilitating rapid development of privately-owned, utility-scale solar PV projects in sub-Saharan Africa. “Scaling Solar” was a “one-stop-shop” package that consolidated various services provided by the World Bank Group (WBG) into a single standardized engagement (e.g., advisory, contracts, financing, guarantees and insurance). The package enabled governments to procure solar transparent and low-cost power, based on the principle of tariff minimization and using a competitive auction process.    Key Enabling Conditions The “Scaling Solar” programme was successful in Zambia for several reasons. First, it enabled rapid bid assessment and implementation by providing fully templated documents and streamlined processes. Second, the “one-stop-shop” approach of the programme combined a wide range of WBG services and helped to mitigate different risks associated with the projects. The programme was able to attract reputable developers and financiers to Zambia’s solar auctions because it offered guarantees and insurance against political risks, which were much sought after by investors.  Impact / OutcomesThe competitive auction organized by the GRZ, alongside the “Scaling Solar” programme, attracted 48 solar power developers, of which seven submitted final proposals. Nine months after the start of the process, the GRZ awarded the 47.5 MW (55 MWp) West Lunga Project to Neoen SAS and First Solar Inc. The GRZ offered a tariff of US¢6.0/kWh – the lowest tariff for solar energy in Sub-Saharan Africa at that time. The 28.2 MW (33 MWp) Ngonye project was also awarded to Enel Green Power with a bid of US¢7.8/kWh. Notably, both winning bidders concluded a power purchase agreement (PPA), selling at a flat price for 25 years. To attract more potential investors, maximize the demonstration effect, and mitigate execution risks, the GRZ decided to award two separate projects to different bidders instead of a single lowest bidder. As of October 2019, both solar plants were successfully constructed, although their combined operational generation capacity of 75.7 MW fell slightly below the target due to delays in reaching financial closure.Additional SourcesGlobal Infrastructure & Natural Resources Department (2018), Scaling Solar: An Update, https://www.mofa.go.jp/files/000340295.pdf IFC (2023), Scaling Solar in Africa, https://www.ifc.org/content/dam/ifc/doc/2023-delta/infra-factsheet-scaling-solar-2023.pdf United Agency for International Development (2018), Review Study of the Zambia Scaling Solar Programme – Final Report, https://pdf.usaid.gov/pdf_docs/PA00ZX2Z.pdf WB (2020), Implementation Completion and Results Report (G-2470, G-2550) on IDA partial risk guarantees in the amount of SDR 4.18 million (US$5.7 million equivalent) to the Republic of Zambia for the Zambia Scaling Solar Energy Project (P157943) and Second Scaling Solar Guarantee (P163958), https://documents1.worldbank.org/curated/en/865501602254044494/pdf/Zambia-Scaling-Solar-Energy-Project.pdf WBG (2018), Financial Solutions Brief Zambia – Scaling Solar, https://thedocs.worldbank.org/en/doc/208821518200595153-0100022018/original/BriefsGuaranteesZambiaScalingSolar.pdfhttps://www.greentechmedia.com/articles/read/can-the-world-bank-groups-scaling-solar-programme-unlock-utility-scale-solar#gs.3S7_K0I https://www.iea.org/policies/5973-zambia-scaling-solar-programmeme?s=1 https://projects.worldbank.org/en/projects-operations/project-detail/P163958?lang=en&tab=procurement&subTab=notices https://www.pv-tech.org/ifc-zambia-solar-auction-sees-record-low-6-price-benchmark/ https://www.pv-tech.org/world-bank-plans-scaling-solar-and-storage-programme/ https://www.roedl.com/insights/renewable-energy/2016-04/scaling-solar-world-bank-initiative-photovoltaics-africa https://www.scalingsolar.org/active-engagements/zambia/ https://www.scalingsolar.org/#toggle-id-10-closed
Zambia
One-stop-shop for Renewable Energy Permits
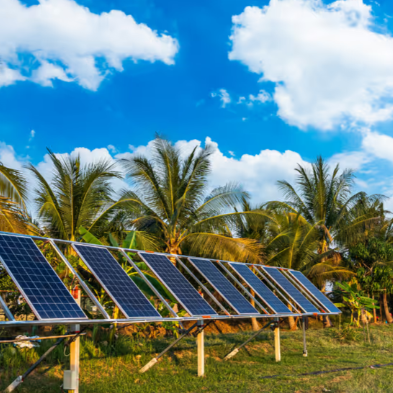
DescriptionProject preparation financing is a de-risking mechanism which consists in financing project preparation activities. Project preparation activities take place prior to financial close and cover a wide range of activities (e.g. establishing the enabling environment, project definition, project feasibility assessment, financial structuring). Project preparation activities can be financed through a number of different facilities. Project Preparation Facilities (PPFs) are dedicated structures, oftentimes dependent on MDBs, that finance project preparation activities mainly through grants. Other entities may also finance project preparation activities through grants (e.g. trust funds, donor programs) or through risk capital or loans (e.g. DFIs, governments).Certain characteristics are regarded as key for PPFs to fulfil their de-risking role successfully: a focused mandate (e.g. specific technologies, project size) in line with their funding capacity; flexible procedures, eligibility criteria and application processes to reflect market developments; and a long lifetime to build on lessons learned and develop expertise. The duration of the PPF can be extended with a self-sustaining funding model, such as repayable grants or convertible instruments.BenefitsBy laying the necessary technical, financial, legal, and governance foundations, project preparation funding helps to reduce the risks typically occurring during the preparation cycle. It increases the likelihood of attracting both public and private sector investment in the subsequent construction cycle. It helps ensure that projects meet necessary conditions such as technical feasibility, regulatory approvals, financial viability, and community acceptance.Figure 1: Sources of financial resources for project preparationSource: ICA, Assessment of Project Preparation Facilities for Africa, 2012, https://www.icafrica.org/fileadmin/documents/Knowledge/ICA_publications/ICA-PPF-Study%20Report-ENGLISH-VOL%20A.pdfCase StudyUSAID clean energy early-stage development facilityThe Clean Energy Finance Facility for the Caribbean and Central America (CEFF-CCA) was a financing initiative designed to stimulate private sector investment in clean energy projects in these regions. Established in 2015 by the US Department of State, USAID, USTDA and the Overseas Private Investment Corporation (OPIC), the two-year program addressed the renewable energy potential of the Caribbean and Central America. CEFF-CCA provided early-stage project development grants to help promising but undercapitalized projects overcome key planning and feasibility challenges, making them attractive for further investment and implementation. CEFF-CCA funding was available to multiple stakeholders (i.e. investors, project developers, public and private sector sponsors) and focused on projects using commercially proven renewable energy technologies for power generation, market-based solutions, and infrastructure catalysts. These projects had to demonstrate social and economic benefits, including improvements in energy access, security, poverty alleviation and gender inclusion. Eligible projects included power generation facilities, small-scale clean energy systems and infrastructure initiatives that enhance the renewable energy sector. CEFF-CCA funds could be used for engineering, legal, consultancy and technical analysis costs.Additional SourcesICA, Assessment of Project Preparation Facilities for Africa, 2012, https://www.icafrica.org/fileadmin/documents/Knowledge/ICA_publications/ICA-PPF-Study%20Report-ENGLISH-VOL%20A.pdfCity Climate Finance Leadership Alliance, Summary of Good Practice of Successful Project Preparation Facilities, 2018, https://gib-foundation.org/wp-content/uploads/2021/08/20180201_PPF_Report_final.pdfUSAID, Assessment of project preparation facilities, 2016, https://pdf.usaid.gov/pdf_docs/PA00M24X.pdfhttps://2012-2017.usaid.gov/where-we-work/latin-american-and-caribbean/clean-energy-finance-facility-caribbean-and-central
Caribbean Countries
Project Preparation Financing
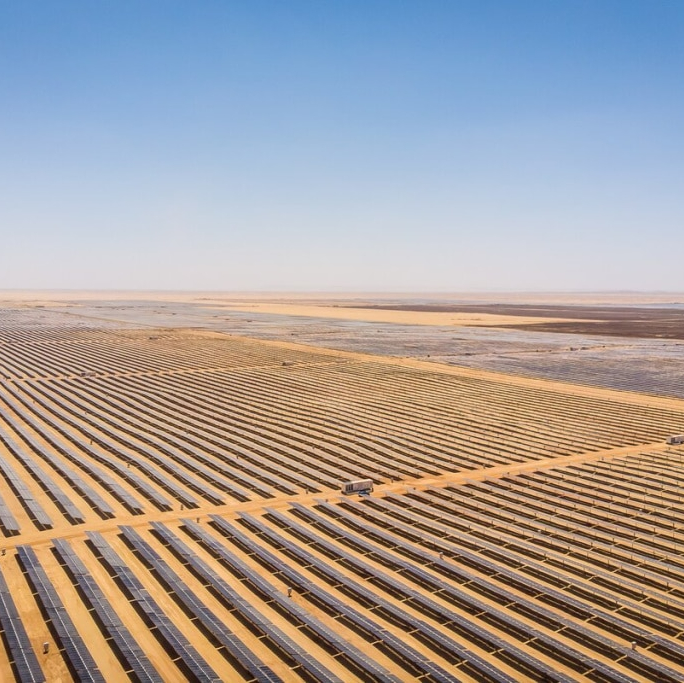
Challenges to Investment  Launched in 2014, Egypt's Feed-in Tariff (FiT) program was established to tackle key obstacles within the renewable, especially solar, energy sector. Prior to the FiT's introduction, the absence of financial incentives deterred investment in solar energy projects, rendering them unappealing to both domestic and international investors and leading to a diminished interest in solar energy. The FiT scheme offered investors assured returns, enhancing the financial attractiveness of solar projects and providing a structured approach for their installation and maintenance. Approach In 2014, Egypt introduced its Feed-in-Tariff (FiT) scheme over two rounds, initially setting a target of installing 2500 MW of renewable energy capacity. In its first round, the government set a rate of 14.3 US cents per kilowatt-hour for solar photovoltaic (PV) projects ranging between 20 to 50 MW to jumpstart the market. The second round adjusted these rates to reflect decreasing global prices, setting a competitive tariff of 8.40 US cents/kWh for projects from 20 to 50 MW. This effectively addressed the first round challenges, including arbitration, and successfully rolled out 1.8 GW of additional renewable energy projects. This initiative included the Nubian Suns project, spearheaded by the International Finance Corporation (IFC), which funded 13 solar PV projects near Aswan, collectively generating 752MWp/590MWac. The IFC helped Egypt implement a strategic approach that enabled project financing for smaller-scale projects. This strategy was based on a uniform set of terms and conditions agreed by both sponsors and banks, simplifying the complicated process of consolidating multiple projects. This innovative approach for the second round of the feed-in-tariff framework secured the title of Global Multilateral Deal of the Year at the PFI Awards 2017. Key Enabling Conditions The Egyptian government's 2035 Integrated Sustainable Energy Strategy laid the groundwork for clean energy initiatives. This strategy, along with international collaboration and financial support helped foster broader investments in renewable energy infrastructure. Furthermore, the World Bank helped the Egyptian government create a conducive regulatory environment by introducing policy reforms and catalyse private sector investments in clean energy. The IFC also helped orchestrate a USD 653 million deal, which included syndicated loans. This innovative financial arrangement brought together a consortium of 18 developers, grouped into six sponsor teams, and 11 financial institutions, showcasing a successful model of public-private partnership for clean energy development.Impact / OutcomesThe program garnered significant interest from investors, with over 20 groups preparing proposals by early 2016, aiming to finalize Power Purchase Agreements (PPAs). The FiT program was instrumental to advancing ventures including the Benban Solar Park, which stands as one of the largest solar power installations globally, encompassing 32 power plants over an area of 37 square kilometers. This flagship project, along with others, funded through the FiT scheme, sought to produce affordable and renewable electricity, provide power to numerous households, avoid carbon emissions, and generate employment during construction. The initiative also received backing from global institutions, including key players such as the IFC,the European Bank for Reconstruction and Development (EBRD), and the French Development Agency (Proparco).By 2017, this initiative had successfully revitalized the renewables sector, drawing in $2 billion from private investors. This influx of investment significantly boosted Egypt's renewable energy output, with an impressive addition of 28,229 MW to the national grid between December 2015 and December 2018 (total capacity to 55 GW). Additionally, the government's efforts to upgrade and expand the distribution grid were crucial in seamlessly incorporating renewable energy sources into the country's power infrastructure. This resulted in an increase in the share of renewable energy in total electricity generation, reaching 12% in 2021. Moreover, solar energy generation increased approximately twentyfold since the introduction of the feed-in-tariff in 2014, until 2021. As private sector engagement is a top priority for Egypt, de-risking tools were deployed and have been instrumental to further enable private sector involvement. The Multilateral Investment Guarantee Agency (MIGA) provided political risk insurance for the construction, operation and maintenance of a number of solar power plants projects in support of Egypt's Solar Feed in Tariff (FiT) program.The EBRD, on the other hand, provided up to USD 500 million in loans to multiple private developers through special purpose vehicles to develop, construct and operate their respective subprojects. Additionally, it provided the Egyptian authorities with technical assistance for the preparation of the Solar Grid Code and the Strategic Environmental and Social Assessment (SESA) for the Benban solar site in Egypt, maximising the benefits for the local population and other stakeholders.Additional SourcesInternational Energy Agency, “Energy Statistics Data Browser: Egypt”, 21 December 2023, https://www.iea.org/data-and-statistics/data-tools/energy-statistics-data-browser?country=WORLD&fuel=Energy%20supply&indicator=TESbySourceInternational Renewable Energy Agency, “Energy Profile: Egypt (2023)”, https://www.irena.org/-/media/Files/IRENA/Agency/Statistics/Statistical_Profiles/Africa/Egypt_Africa_RE_SP.pdfUNESCAP. (n.d.). Feed-In Tariff. Retrieved April 8, 2024, from unescap.org/sites/default/files/26. FS-Feed-In-Tariff.pdfhttps://pressroom.ifc.org/all/pages/PressDetail.aspx?ID=17490https://www.cliffordchance.com/content/dam/cliffordchance/briefings/2018/02/egypt-solar-feedin-tariff-round-2.pdfhttps://www.ebrd.com/work-with-us/projects/psd/egypt-renewable-feedintariff-framework.html
Egypt
Feed-in-Tariff (FiT)
Challenges to InvestmentBefore Mexico’s energy reform in 2013, its legal framework stipulated that electricity services should be provided exclusively by the state-owned electricity company, Comisión Federal de Electricidad (Federal Electricity Commission; CFE). Though private investment in generation was permitted under various mechanisms, renewable energy was not competitive with traditional sources. To incentivize private investment in renewable energy, the Comisión Reguladora de Energía (Energy Regulatory Commission; CRE) needed to develop regulatory instruments that were effective but not as costly as subsidies. In addition, the instruments would need to support renewable energy generation which is location-specific, such as wind and solar.ApproachAmong other measures, the Mexican government introduced a power wheeling mechanism to promote private investment in renewable energy. With respect to transmission, wheeling means that power can feed into the network from outside the grid boundaries, allowing users to purchase electricity from producers other than their local generator. Power wheeling helps improve economics for renewable energy projects, as renewable generators can set up in cost-effective locations while selling to consumers anywhere in the country, without heavy transmission costs. Additionally, the wheeling fee applied to renewable generators is lower than that of traditional energy sources. The fee for each load point was determined by adding up the fees associated with each voltage level necessary to transport energy from the generation center to the load, ensuring that it would not include multiple charges for each voltage level. Those fees comprised expenses associated with infrastructure usage, losses, transmission services, and a fixed charge for administering the interconnection agreement. Renewable generators could wheel energy to their associated load centers and potentially serve several medium to large load center off-takers. However, wheeling was limited only to those load centers with which the generators had signed power purchase agreements (PPAs). The monthly adjustments to the fee – after accounting for inflation – provided developers with greater predictability about future costs of renewable energy projects.  Key Enabling ConditionsThe power wheeling mechanism saw immediate acceptance from relevant stakeholders (e.g., Ministry of Energy, the CFE, financing entities, developers, permit holders, and investors). Renewable energy acceptance under the power wheeling mechanism was also enhanced by other features under the RE Act (2008) such as energy banking and net metering. Beyond the RE Act (2008), the Ministry of Energy (SENER) sought to achieve the target of 35% of electricity generation contributed by clean energy by 2024 in the 2012 General Climate Change Law, driving a number of policy and initiatives including the renewable energy certificate mechanism (Clean Energy Certificates, or CELs).Impact / OutcomesThe wheeling power mechanism (among other established instruments) helped Mexico significantly increase its total installed clean energy capacity (including renewable, hydroelectric, and nuclear generation), from 13.8 GW in 2008 to 15.1 GW in 2015. Installed capacity of hydroelectric (80%) – which is highly specific to geographic locations – made the largest contributions to clean energy capacity in 2015. Moreover, privately-owned projects accounted for over 40% of Mexico's total electricity generation by the end of 2014. By providing certainty over the costs of transmission fees, the mechanism promoted healthy competition between renewable and conventional project developers, without imposing additional costs on consumers. Finally, the policy helped to mitigate the location problem for renewable energy projects, such as the distance from generation to load centers.Additional Sourceshttps://prod.iea.org/policies/4313-wheeling-service-agreement-for-electricity-from-renewable-energy-sources-convenio-para-el-servicio-de-transmision-de-energia-electrica-para-fuente-de-energia-renovable https://www.purnomoyusgiantorocenter.org/power-wheeling-and-clean-energy-development/ IRENA (2015), Renewable Energy Policy Bries: Mexico, https://www.irena.org/-/media/Files/IRENA/Agency/Publication/2015/IRENA_RE_Latin_America_Policies/IRENA_RE_Latin_America_Policies_2015_Country_Mexico.pdfLinvill, C., Brutkoski, D. (2017), Designing Distributed Generation in Mexico, https://www.nrel.gov/docs/fy17osti/66026.pdf NREL (2016), Wheeling and Banking Strategies for Optimal Renewable Energy Deployment: International Experiences - Mexico Case Study, https://www.nrel.gov/docs/fy16osti/65660.pdf Wilson Center (2013), Renewable Energy in Mexico: Policy and Technologies for a Sustainable Future, https://www.wilsoncenter.org/sites/default/files/media/documents/publication/Renewable_Energy_in_Mexico.pdf
Mexico
Power Wheeling Mechanism
Challenges to investment In 2012, Mexico's electricity sector was characterized by a vertically integrated monopoly, with the Comisión Federal de Electricidad (CFE) Iserving as the state-owned electricity company. CFE was responsible for most of the country’s generation, transmission, and distribution. However, the sector faced severe challenges such as high annual distribution losses and heavy reliance on natural gas, which, at the time, accounted for more than half of electricity generation. These problems were compounded by insufficient investment in electricity infrastructure, due in part to the lack of private sector participation. To open the sector to private investment and stimulate competitiveness and incorporate sustainability across the entire value chain, several policies and laws were put in place to promote competition, strengthen the energy regulatory agency, increase transparency, and reduce corruption. The entire electricity market reform aimed to lower generation costs, increase the share of renewable energy (RE) sources, and reduce transmission and distribution losses.Approach The Mexican energy sector reform took place in the years 2013-2014 and introduced significant changes to the structure and operations of the CFE. The CFE was transformed into a holding company. The new CFE holding company was divided into 13 subsidiaries allocated respectively to three distinct functions: generation, transmission, and distribution. After the reform was completed, both the CFE generation subsidiaries and other Independent Power Producers (IPPs) could generate electricity, enhancing competition and allowing Mexico to establish a wholesale electricity market and long-term auctions. While CFE maintained exclusive rights over transmission and distribution, its transmission and distribution entities could enter into public-private partnership (PPP) contracts with private corporations to develop new transmission and distribution infrastructure. Key Enabling Conditions  One of the key features in restructuring Mexico’s energy sector was the long-term auction process as a competitive bid mechanism. In addition, economic imperatives such as the need to lower transmission and distribution losses fostered political commitment to the reform, ensuring its effective implementation and continued progress.  Impact / OutcomesFollowing the 2013-2014 energy sector reforms, Mexico saw significant expansion in RE installed capacity, which rose from 3.5 GW in 2013 to 9.5 GW in 2018. Likewise, RE’s share of total generation grew from 4% to 7% over the same period (excluding hydropower). The introduction of long-term competitive generation auctions led to a substantial decrease in renewable generation prices, with solar energy prices dropping to MXN/kWh 0.344 ($/kWh 0.0179), while wind energy prices reached MXN/kWh 0.341 ($/kWh 0.0177). As the reforms boosted Mexico’s attractiveness for RE, it became one of the top ten destinations for RE investment in 2015. Total investments in renewable energy continued to increase, reaching $6.2 billion in 2017 with one third of installed generation capacity privately owned. A study commissioned by the Centro de Estudios del Sector Privado para el Desarrollo Sustentable (Cespedes) projected that up to 180,000 local jobs in the renewable energy industry could be created in the next decade.An in-depth study conducted by the Secretaría de Energía in 2016 provided a, in-depth, job-by-job inventory of the workforce needs of the renewable energy supply chain to address and anticipate skills shortages, particularly in construction (e.g., construction support workers, steel structural assemblers, civil and construction engineers).Additional SourcesBloombergNEF (2019), The Clean Technology Fund and Concessional Finance: Lessons Learned and Strategies Moving Forward, https://assets.bbhub.io/professional/sites/24/BNEF_The-Clean-Technology-Fund-and-Concessional-Finance-2019-Report.pdf BMWi & Sener (2018), Growing investment opportunities: Mexico’s new energy era from framework fundamentals to power sector focus, https://www.energypartnership.mx/fileadmin/user_upload/mexico/media_elements/reports/Mexico_s_New_Energy_Era-PDF.compressed.pdf Chanona Robles, A. (2016), Tracking the progress of Mexico’s power sector reform, https://www.wilsoncenter.org/sites/default/files/media/documents/publication/tracking_progress_of_mexicos_power_sector_reform.pdf Geddes, A., et al. (2020), Rethinking Eskom: Lessons from electricity sector reform in India and Mexico, https://www.iisd.org/system/files/publications/rethinking-eskom.pdf Guerrero, G. T. (2016), Corruption in the Mexican Energy industry: Recommendations and proposals, https://www.wilsoncenter.org/sites/default/files/media/documents/publication/corruption_in_the_mexican_energy_industry_recommendations_and_proposals.pdf Nance, P. (2018), Initial results from the Mexico electricity reform, 2013-18, https://www.wilsoncenter.org/sites/default/files/media/documents/publication/mexicos_new_energy_reform.pdf Sener (2018a), Informe pormenorizado sobre el desempeño y las tendencias de la industria eléctrica nacional 2017, https://www.gob.mx/cms/uploads/attachment/file/415850/Informe_Industria_Electrica_2017.pdf Sener (2018b), Prodesen 2018-2032, https://www.gob.mx/cms/uploads/attachment/file/331770/PRODESEN-2018-2032-definitiva.pdf Vietor, R. H. K., & Sheldahl-Thomason, H. (2017), Mexico’s energy reform https://hepg.hks.harvard.edu/files/hepg/files/mexican_energy_reform_draft_1.23.pdf
Mexico
Separation of Power Sector
Challenges to investment  In the 2010s, India faced significant challenges managing greenhouse gas (GHG) emissions. As a rapidly developing economy, India was undergoing fast industrialization and urbanization, which led to increased energy consumption and GHG emissions. Under the 2009 Copenhagen Accord, India endeavored to reduce the GHG emissions intensity of its GDP by 20–25% below 2005 levels by 2020. However, India lacked a framework for GHG emission reporting and a carbon market to incentivize emission reduction, as well as the technical capacity to measure and manage emissions.  Approach To resolve these challenges and assist India’s corporate sector to meet its GHG emissions reduction targets, World Resources Institute (WRI) India in coloration with, the Confederation of Indian Industry (CII), and The Energy and Resources Institute (TERI) launched the India Greenhouse Gas Program (India GHG Program) in 2013. The voluntary GHG Program aimed to help companies measure and manage GHG emissions, establishing a voluntary reporting framework based on international standards and then helping companies with technical capacity, reporting and target setting, identifying emission reduction opportunities, and other options for carbon neutrality. In return for their participation, WRI, CII, and TERI offered technical assistance and opportunities for public visibility.  Key Enabling Conditions  Several conditions helped the GHG program successfully engage companies and lower GHG emissions. Over and above, India’s commitment to its National Action Plan on Climate Change (NAPCC) and international climate agreements has provided a strong policy backdrop for emissions reduction initiatives such as the GHG program and others such as the Perform, Achieve, Trade (PAT) scheme. The government also provided financial incentives for clean energy investment, energy efficiency, and emission reduction. The GHG program also benefitted from active industry participation and leadership, which helped to raise public awareness and incentivize company participation and voluntary emission reduction. By addressing key challenges and leveraging enabling conditions, the program has made notable progress in reducing emissions and fostering a culture of sustainability within India’s industrial sector, hereby creating a more conducive environment for clean energy finance.Impact / OutcomesDespite being voluntary, the GHG program was successful in engaging companies, with over 50 companies participating by 2017 which, together, contributed 15% of India’s total GHG emissions each year. Participating companies reported significant reductions in their GHG emissions, as well as increased interest in clean energy investments as a way to support India’s targets when it came to lowering net emissions. These efforts helped India meet its pledge under the Copenhagen Accord, achieving a 24% reduction in GDP emissions intensity, excluding land-use, land-use change, and forestry (LULUCF). Importantly, this voluntary program represented a significant initial step towards comprehensive emission reduction and laid the groundwork for additional decarbonization measures (e.g., the 2023 Carbon Credit Trading Scheme). Additional SourcesShakti Foundation, “Measuring and Tracking GHG Emissions: A concrete path to climate progress”, https://shaktifoundation.in/wp-content/uploads/2017/12/MRV-Brochure-23-nov.pdfUNFCCC. “Letter including India’s domestic mitigation actions”, https://unfccc.int/files/meetings/cop_15/copenhagen_accord/application/pdf/indiacphaccord_app2.pdfNational Action Plan on Climate Change, Prime Minister’s Council on Climate Change, https://archivepmo.nic.in/drmanmohansingh/climate_change_english.pdfIndia GHG Program, https://indiaghgp.org/Climate Action Tracker, https://climateactiontracker.org/countries/india/targets/#:~:text=2020%20pledge,emissions%20from%20the%20agricultural%20sectorWorld Resources Institute. “India GHG Program Launches with More Than 20 Leading Companies.” 22 July 2013. https://www.wri.org/news/release-india-ghg-program-launches-more-20-leading-companiesCarbon Credits. “India Revises Its Carbon Credit Trading Scheme for Voluntary Players”. 22 February 2024. https://carboncredits.com/india-revises-its-carbon-credit-trading-scheme-for-voluntary-players/#:~:text=In%202023%2C%20India%20introduced%20the,of%20the%20voluntary%20carbon%20marketIEA (2023). Energy Statistics Data Browser, IEA, Paris https://www.iea.org/data-and-statistics/data-tools/energy-statistics-data-browser
India
GHG Emission Reporting Scheme
Challenges to investment In the 2010s, Ethiopia, with its vast renewable energy (RE) potential, particularly in hydro, wind, and solar power, faced significant challenges in promoting clean energy. Biofuels and fossil fuel sources dominated Ethiopia’s energy supply, representing 93% and 6%, respectively, of the total energy supply in 2010. Ethiopia had complex and overlapping regulatory frameworks for RE and the government agencies that oversaw relevant land, energy, and environmental permitting had difficulty coordinating, given insufficient frameworks and limited institutional capacity. To encourage private investment, Ethiopia needed to streamline the property registration process for renewable energy projects.   Approach In 2013, Ethiopia launched a multi-faceted approach to facilitate coordination between different institutions involved in the property registration process for RE projects, instituting overarching legal and regulatory frameworks and improving coordination between governing institutions. The government implemented Energy Proclamation No. 813/2013 and Ethiopian Energy Authority Establishment Council of Ministers Regulation No. 308/2014 to govern the RE sector, providing a clear legal basis for RE projects.  The government also moved to standardize land administration under the Ministry of Agriculture and Natural Resources (MOA), which governs large scale investment on agricultural lands via the Ethiopian Agricultural Investment Land Administration Agency (EAILA) and rural investment via the Rural Land Administration & Use Directorate (RLAUD). These efforts helped streamline the process for investment and land registration for RE projects, increasing certainty and reducing timelines for approval.  The regulations set clear tasks for the agencies governing the energy sector. The Ethiopian Energy Authority (EEA) was made responsible for issuing generation licenses and authorizing the generation of electricity from renewable energy facilities. Independent Power Producers (IPPs) seeking to develop projects in Ethiopia must enter into Power Purchase Agreements with the Ethiopian Electric Power (EEP), the state-owned power generation agency.    Key Enabling Conditions Several enabling conditions contributed to the success of Ethiopia’s coordinated approach. The Ethiopian government's strong commitment to promoting renewable energy and streamlining property registration processes was crucial. The establishment of clear and coherent laws governing land administration and renewable energy development provided a solid foundation for coordination. Investment incentives, such as those outlined in the Ethiopian Investment Proclamation No. 769/2012 and NBE Directive No. FXD/70/2020, facilitated foreign investment and financing for renewable energy projects. International support from organizations like USAID and the World Bank played a vital role in implementing land certification programs and enhancing institutional capacity. Last, effective collaboration between different institutions involved in land and energy administration ensured that processes were streamlined and efficient. Impact / Outcomes The coordinated approach yielded significant outcomes in streamlining the property registration process and promoting renewable energy projects, while also improving institutional capacity. Improved coordination between RLAUD, EEA, and EEP led to more efficient processing of land registrations and permits for RE projects. As a result, RE’s share of Ethiopia’s total energy supply increased from 1.8% in 2010 to 2.9% by 2021. Following the reforms, Ethiopia launched several large RE projects, including the Ashegoda Wind Farm (120 MW), and secured financial and technical assistance from international donors such as the IFC’s Scaling Solar program (500 MW). In part due to private investment, Ethiopia was also able to achieve broader social goals. For example, the population’s access to electricity expanded from 25.5% in 2010 to 54.2% in 2021.Additional SourcesUSAID. Ethiopia Land Administration to Nurture Development (LAND) Quarterly Report No 18 July-September 2017. https://pdf.usaid.gov/pdf_docs/PA00N4CV.pdfhttps://www.irena.org/-/media/Files/IRENA/Agency/Statistics/Statistical_Profiles/Africa/Ethiopia_Africa_RE_SP.pdfIEA (2023), Energy Statistics Data Browser, IEA, Paris https://www.iea.org/data-and-statistics/data-tools/energy-statistics-data-browser IEA (2023), Ethiopia Country Profile, IEA, Paris https://www.iea.org/countries/ethiopiaIEA (2023), Africa Energy Outlook 2019: Ethiopia, IEA, Paris https://www.iea.org/articles/ethiopia-energy-outlookhttps://www.se4all-africa.org/seforall-in-africa/country-data/ethiopia/https://www.land-links.org/2016/05/land-certification-in-ethiopia-lessons-from-usaids-first-completed-land-sector-impact-evaluation/ https://www.land-links.org/project/ethiopia-strengthening-land-tenure-and-administration-program/ https://www.land-links.org/project/ethiopia-land-administration-program/ https://www.afdb.org/fr/documents/ethiopia-ethiopia-renewable-energy-program-phase-i-erep-i-enabling-environment-sefa-appraisal-report https://projects.worldbank.org/en/projects-operations/project-detail/P160395 https://www.worldbank.org/en/news/press-release/2019/05/23/world-bank-group-supports-ethiopia-in-providing-reliable-energy-and-creating-opportunities-for-private-investment-in-the-sector https://projects.worldbank.org/en/projects-operations/project-detail/P162607?lang=en https://www.lexology.com/library/detail.aspx?g=4252e759-8cf7-4129-919e-4bb75476e3d1
Ethiopia
Property Registration Institution Coordination
DescriptionThe Pay-As-You-Save (PAYS) model is a financing mechanism designed to eliminate the upfront cost barriers associated with investing in energy-efficiency improvements (e.g., thermal insulation, electric mobility) or renewable energy projects. In this model, a utility company covers the initial costs of the equipment and recoups its investment over time through a fixed charge on the customer's utility bill. This charge is structured to be less than the estimated savings generated by the new equipment, ensuring the customer experiences immediate financial benefits without incurring additional debt. If the fixed charge over the warranty period is insufficient to cover the total cost of the energy-efficiency improvement, the gap can be bridged by additional resources (e.g., grants) – though in a lower proportion than would be needed to cover the entire incremental costs upfront. BenefitsA PAYS scheme allows to remove upfront capital expenditure for customers, allowing them to adopt energy-efficient technologies, while maintaining energy affordability in check, without needing additional debt. It also allows to serve customers with poor or non-existent credit ratings. For utility companies, PAYS provides a secure and reliable mechanism to recover investments as bill payments are not considered debt reimbursement but operating revenue. Additionally, PAYS can accelerate the path to commercial viability for new clean energy solutions, supporting broader environmental goals by promoting innovative energy-efficient technologies. This model also provides a way to bridge funding gaps with additional resources, such as grants, further enhancing its appeal and effectiveness. Case StudyAspiration Energy deploying a PAYS model for solar water heating systems in IndiaAspiration Energy, an India-based energy service company (ESCO), implemented a PAYS model to promote solar water heating systems for industrial processes. Founded on a "no initial capital expenditure" approach, the company designs, installs, and operates solar thermal systems, allowing industrial clients to adopt energy-efficient solutions without upfront costs. In 2013, Aspiration Energy's innovative business model received the Parivartan Award for Innovation.One notable installation made by the company is the Wheels India, where Aspiration Energy's solar water heating system replaced oil boilers, saving nearly INR 7 million in fuel oil costs within the first eighteen months of operation. This success led Wheels India to expand solar water heating across its factories nationwide, displacing 360 liters of fuel oil daily.Aspiration Energy's PAYS model proved effective not only for solar thermal systems but also for solar battery backup systems and solar power for telecommunication networks. This approach facilitated broader adoption of clean energy technologies, driving both economic savings and significant environmental benefits in India's industrial sector.Additional SourcesPay As You Save For Clean Transport, Global Innovation Lab for Climate Finance, 2018, https://www.climatefinancelab.org/wp-content/uploads/2018/02/PAYS-for-Clean-Transport_Instrument-Analysis.pdfInnovative Financing For Renewable Energy, Pace Environmental Law Review, 2015, https://digitalcommons.pace.edu/cgi/viewcontent.cgi?article=1778&context=pelr
India
Pay-As-You-Save
Challenges to investment During the 2000s, patent filings in Brazil surged by 71%, nearly 80% higher than other Latin American nations and 35% above the global average. This rapid increase, combined with operational hurdles and a complex intellectual property (IP) regulation, caused a significant backlog of unexamined patent applications. Lengthy processing delays created legal uncertainty for applicants, hindered entrepreneurs' ability to commercialize and license technologies, and prevented them from securing returns on their investments. For clean energy in particular, the delays impeded funding for R&D activities, the promotion of eco-friendly innovation, and start-up’s ability to raise private capital and disseminate clean technologies.  Approach On 17 April 2012 (by Resolution 283/2012), Brazil's National Institute of Industrial Property (INPI) launched the Green Patents program as a pilot program to fast-track patent applications related to environmentally beneficial technologies. By expediting the examination of patent applications, the program aimed to foster an eco-friendly innovation and licensing environment. Eligible green technologies covered five encompassing categories such as alternative energy, transportation, energy conservation, waste management, and agriculture. The program progressed through three phases and one extension, with Resolution 175/2016 permanently establishing the program as of 6 December 2016. The INPI also expanded the program to include both national and international applications without filing date restrictions.  The Green Patents program offered three distinct advantages: flexibility, reduced costs, and prioritization. The program allowed applicants to request participation at any stage of the patent application process, including during the appeal stage. Additionally, the program entailed lower official fees compared to other requests, reducing costs significantly. While obtaining Green Patents status didn't guarantee application approval, it did prioritize examination, expediting approval timelines. Despite the benefits of the Green Patents program, applicants did have to pay an additional fee to expedite their patent examination, as well as file additional documents to request the green technology designation. To resolve these issues, the program was further upgraded in 2020 through INPI/PR Regulation No. 247, which covered not only the anticipation of examinations, but all activities of the patent procedure. Key Enabling Conditions Besides the direct benefits of the accelerated process, the issued Green Patent label provided additional recognition to market participants and effectiveness of the technologies, aiding in attracting customers and investors. Moreover, the development and permanent introduction of the Green Patent program ensured long-term planning safety and reduced uncertainty, enabling companies to leverage their innovations more effectively. Impact / Outcomes Over the first four years after its launch, the Green Patents program received more than 400 patent applications, such as mechanical, chemical and industrial engineering and process improvements related to clean energy. With thousands of applications through March 2024, the program had already filed around 870 patent applications by April 2020. Over 2022-23, the average time from the request for participation to the issuance of a decision was about nine months, compared to three years and seven months for a regular patent application. Despite its success, the program remained relatively unknown to international applicants, with over 70% of participants being Brazilian, followed by American (7%) and Chinese (2%). Additional SourcesDechezleprêtre, A. (2013); Fast-tracking Green Patent Applications: An Empirical Analysis; ICTSD Program on Innovation, Technology and Intellectual Property; Issue Paper No. 37; International Centre for Trade and Sustainable Development, Geneva, Switzerland, https://www.files.ethz.ch/isn/161230/fast-tracking-green-patent-applications-an-empirical-analysis.pdf Paula Gomes Pinto, A. (2020). IP Regulations and Environmental Agreements: An Overview of the Brazilian Green Patents Service. In O. M. D. C., & O. M. D. L. P. I. (Eds.), Research Papers from the 2019 WIPO-WTO Colloquium for Teachers of Intellectual Property Law (pp. 29-44). World Trade Organization (WTO), https://www.wto.org/english/tratop_e/trips_e/colloquium_papers_e/2019/chapter_3_2019_e.pdf https://www.lickslegal.com/articles/green-patents-encouraging-sustainable-innovation-in-brazil https://www.linkedin.com/pulse/fast-track-patent-grant-procedure-green-technologies-brazil-magda/ https://www.mondaq.com/brazil/patent/1455036/patents-in-the-field-of-green-technologies https://patentblog.kluweriplaw.com/2024/04/15/green-patents-encouraging-sustainable-innovation-in-brazil/#:~:text=The%20BRPTO's%20Green%20Patents%20Program,in%20these%20first%20four%20yearshttps://www3.wipo.int/wipogreen/en/news/2021/news_0016.html
Brazil
‘Fast-track’ Process for Patenting Clean Energy Technologies
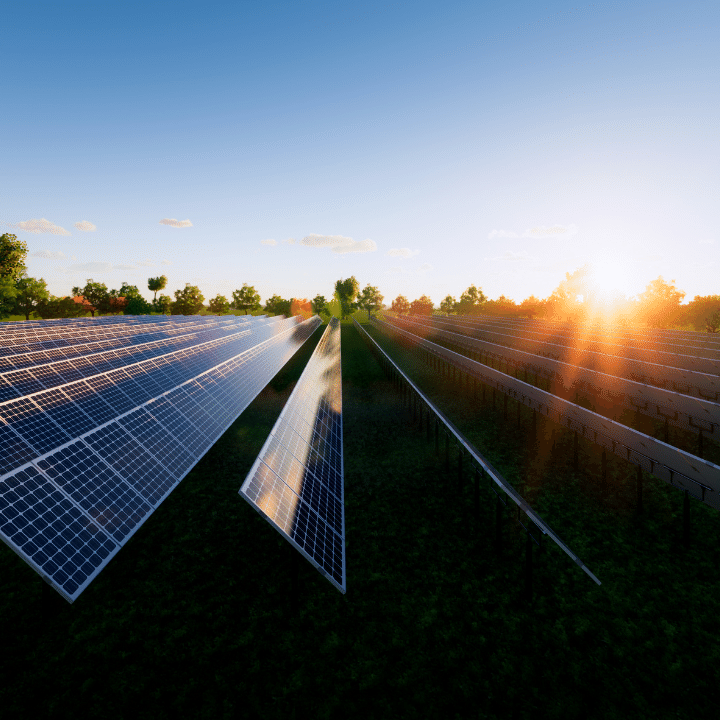
Challenges to Investment  Before 2011, South Africa had minimal renewable energy capacity, with over 90% of electricity generated from coal and controlled by the state-owned utility, Eskom. Participation from Independent Power Producers (IPPs) was low, given perceived risks to investment including financing challenges and inadequate grid infrastructure. Potential private sector investors also cited limited confidence because of the lack of clarity on energy sector governance, procurement, and evaluation processes. As a result, South Africa had limited success in expanding overall electricity generation and attracting investments in clean energy.  Approach To address these challenges, in 2011, the South African Department of Mineral Resources and Energy (DMRE) launched the Renewable Energy Independent Power Producer Procurement Programme (REIPPPP) to replace the existing Feed-in-Tariff system that was active since 2009. The REIPPPP implemented a competitive bidding process, whereby private sector developers would submit proposals to build and operate renewable energy projects during a “bid window.” Qualified technologies included onshore wind, solar PV, solar thermal, solid biomass, biogas, landfill gas, and small hydroelectric plants.The bid window was structured as a one-stage tender, where bidders could compete for a fixed amount of MW for each technology. All compliant offers were allowed to participate, fostering competition, but were subject to stringent proposal requirements, with winning bidders selected based on bid price and a range of economic development criteria (e.g., job creation and localization). For each technology, bid prices had to be equal or lower than the technology tariff cap set by the government. Finally, winning bidders were required to sign standardized, non-negotiable contracts. The contracts were 20-year inflation-indexed power purchase agreements (PPAs), paid by Eskom and 100% guaranteed by the National Treasury (falling to 80% in Bid Window 7 in 2023).   Key Enabling Conditions Ongoing improvements in the bidding process and transparent procurement processes enhanced efficiency and ensured fair competition among bidders in the REIPPPP. Moreover, the availability of guaranteed long-term tariffs, the size of the program, and the speed of implementation all helped to instill greater investor confidence. Last, South Africa’s well developed capital market facilitated access to long-term financing, enabling the successful financing and execution of REIPPPP projects.Impact / OutcomesAs of May 2024, the DMRE had completed six bid windows, with projects awarded in Bid Window 5 (BW5) already under construction and most projects awarded in BW6 nearing financial close. From 2010 to March 2019, the first four bid windows of the REIPPPP programme attracted significant private sector investments of $20.5 billion (ZAR209.7 billion). Out of this figure, 20%, or $4.1 billion (ZAR41.8 billion) came from foreign direct investment. These investments amounted to over 6,200 MW of capacity across 92 IPPs, with wind and solar PV projects comprising 86% of the total. The competitive bidding process led to an average tariff reduction of 52% and 26% for solar PV and wind, respectively, even lower than tariffs for new coal and nuclear power plants. Moreover, the programme projected the creation of 109,444 jobs for local citizens, with 84,564 jobs specifically benefiting black citizens and 57,690 jobs benefiting the local communities surrounding the project sites.Additional SourcesEberhard, A., Kolker, J., Leigland, J. (2014), South Africa’s Renewable Energy IPP Procurement Program: Success Factors and Lessons, https://www.gsb.uct.ac.za/files/ppiafreport.pdf Eberhard, A., & Naude, R. (2016), The South African Renewable Energy Independent Power Producer Procurement Programme: A review and lessons learned, Journal of Energy in Southern Africa,27(43), 1-14, https://scielo.org.za/pdf/jesa/v27n4/01.pdf Eberhard, A., & Naude, R. (2017), The South African Renewable Energy: IPP Procurement Programme, https://www.gsb.uct.ac.za/files/EberhardNaude_REIPPPPReview_2017_1_1.pdf GGA (2023), The state of the renewable energy independent power producer procurement programme: Where to from here? https://digitalmallblobstorage.blob.core.windows.net/wp-content/2023/12/IR-REIPPPP.pdf Kruger, W. (2023), South Africa’s Renewable Energy Auctions: An Exploration of Factors, Processes and Outcomes, Administratio Publica, 31(2), https://journals.co.za/doi/epdf/10.10520/ejc-adminpub_v31_n2_a4 Leigland, J., & Eberhard, A. (2018). Localisation barriers to trade: The case of South Africa’s renewable energy independent power program. Development Southern Africa, 35(4), 569–588. https://doi.org/10.1080/0376835X.2018.1487829 PCC (2023), A Critical Appraisal of South Africa’s Just Energy Transition Investment Plan, https://pccommissionflow.imgix.net/uploads/images/PCC-analysis-and-recommenations-on-the-JET-IP-May-2023.pdf Winkler, A., Keen, S., Marquard, A. (2021), Funding to set up the Renewable Energy Independent Power Producer Procurement Programme in South Africa, https://www.diw.de/documents/dokumentenarchiv/17/diw_01.c.794589.de/background_report_south_africa_funding.pdf https://fsr.eui.eu/contracts-for-difference/ https://www.gov.za/about-government/government-programmes/renewable-independent-power-producer-programme https://www.iea.org/policies/5393-renewable-energy-independent-power-producer-programme-reippp https://www.ipp-projects.co.za/ https://www.pv-magazine.com/2021/09/30/reippp-one-of-the-worlds-best-renewable-energy-tenders-but-theres-room-for-improvement/
South Africa
Contract-for-difference Schemes
Challenges to investment In 2010, Ghana set a target for modern renewable energy (RE) to contribute 10% to the country’s energy generation mix by 2020. At that time, the country relied primarily on a fragile hydropower system, along with oil and gas. Supply deficits led to frequent shortages and blackouts. To achieve energy security and resilience, Ghana intended to increase its generation capacity by diversifying sources, including renewable energies such as solar, wind and hydro. The energy sector in Ghana comprised three segments: transmission, distribution, and generation. In the generation sector, state-owned entities Volta River Authority (VRA) and Bui Power Authority (BPA) held dominant positions, while Independent Power Producers (IPPs) could also generate electricity in theory. However, private investments in RE generation faced a difficult investment climate characterized by high commercial rates, limited tenor loans, high inflation and currency volatility. Additionally, Ghana lacked the technical capacity and personnel to construct, operate, manage and maintain RE initiatives, as well as a regulatory framework to govern them. Last, Ghana’s energy sector entities, financiers and domestic investors lacked the experience to envision, fund and execute RE projects.  Approach Among several energy policies and programs, Ghana's primary legislation governing the RE sector was the Renewable Energy Act (Act 832). Enacted in 2011, the RE Act provided both the legal and regulatory framework for achieving RE targets and diversifying energy supply. The RE Act included specific measures to increase the use of RE in Ghana. These measures comprised a Feed-in-Tariff scheme for RE, RE purchase obligations, licensing procedures for commercial activities in RE, and the establishment of the Renewable Energy Authority. One key goal of these measures was to create a more attractive environment for private sector investment in RE. The RE Act specifically addressed Independent Power Producers (IPPs) for RE. Although power sector reforms in 1994 had permitted private sector engagements, resulting in the establishment of the first two IPPs in 1997 and 2010, these reforms did not provide a framework that was specific for RE IPPs. Key Enabling Conditions A combination of strong policy commitments by Ghana’s government and external support for regulatory matters, particularly through international initiatives like Power Africa, spurred RE deployment and positively influenced investors’ perception of risk. Ghana also benefitted from additional energy-sector assistance from other programs such as the Scaling-up Renewable Energy Program in Ghana, via the African Development Bank (AfDB) and the International Finance Corporation (IFC). These external partners and initiatives aligned with Ghana’s national priorities, enhancing the technical, financial, regulatory, and institutional capacity of the energy sector and RE in particular.   Impact / OutcomesAs of 2021, RE generation in Ghana reached 152 GWh. The sources included three state-owned solar farms producing around 98 GWh (VRA Navrongo, Kaleo/Lawra, Bui Solar Farm) and three IPPs generating roughly 57 GWh (BxC Solar, Meinergy, and Safi Sana). Despite these contributions, the overall development experienced a shortfall versus the national energy target. The share of RE in the energy generation mix was 1% in 2017 and increased marginally to 2% in 2018. Consequently, the original target of 10% by 2020 was adjusted to 2030. In April 2023, Ghana lifted its moratorium, in place since 2020, on issuing wholesale electricity supply licenses for RE embedded generation projects. Companies in the industry are now allowed to apply for licenses to develop RE generation projects for private and personal use. Additional SourcesAckah, I., Auth, K., Kwakye, J., Moss, T. (2021). A Case Study of Ghana’s Power Purchase Agreements, https://energyforgrowth.org/wp-content/uploads/2021/03/A-Case-Study-of-Ghanas-Power-Purchase-Agreements.pdf Agyepong, E. Y. (2019). Regulatorische Rahmenbedingungen des aktuellen Strommarktes n Ghana, https://www.german-energy-solutions.de/GES/Redaktion/DE/Publikationen/Praesentationen/2019/1902226-iv-ghana-praes-04.pdf%3F__blob%3DpublicationFile%26v%3D2 Energy Commission Ghana (2019). Ghana Renewable Energy Master Plan, https://www.energycom.gov.gh/files/Renewable-Energy-Masterplan-February-2019.pdf IRENA (2015). Ghana: Renewables Readiness Assessment, https://www.irena.org/-/media/Files/IRENA/Agency/Publication/2015/IRENA_RRA_Ghana_Nov_2015.pdf Kuamoah, C. (2020). Renewable Energy Deployment in Ghana: The Hype, Hope and Reality, Insight on Africa, 12:1, 45-64, https://journals.sagepub.com/doi/full/10.1177/0975087819898581 Ministry of Power (2024). Scaling-up Renewable Energy Program in Ghana (SREP): Investment Plan, https://www.cif.org/sites/default/files/meeting-documents/srep_ghana_investment_plan_27_04_2015.pdf USAID (2016). Power Africa in Ghana – Factsheet, https://www.usaid.gov/sites/default/files/2022-05/Ghana%20Country%20Fact%20Sheet__6.21.16.pdf https://www.iea.org/data-and-statistics/data-tools/energy-statistics-data-browser?country=GHANA&fuel=Energy%20supply&indicator=ElecGenByFuelhttps://www.templars-law.com/app/uploads/2024/02/Navigating-the-Regulatory-Landscape-of-Renewable-Energy-Investments-in-Ghana.pdf https://www.trade.gov/country-commercial-guides/ghana-energy-and-renewables#:~:text=Thermal%20generation%20accounts%20for%20the,%2C%20Benin%2C%20and%20Burkina%20Faso
Ghana
Power Generation opened to Independent Power Producers
Challenges to investment Before 2011, Malaysia faced significant challenges promoting investment in renewable energy (RE). Malaysia’s highly subsidized electricity tariffs made it difficult for RE and other energy efficiency (EE) initiatives to compete with traditional fossil fuels, creating major barriers to implementation and long-term viability. Because fossil fuel subsidies kept energy prices relatively low, there was little urgency surrounding the development of RE during that period. Recognizing that RE development would be critical to Malaysia’s future, the Malaysian government sought to incentivize RE producers by reducing long-term risks and ensuring return on investment, aiming to make RE a significant part of the country's energy mix.  Approach In December 2011, under the Renewable Energy Act 2011, the Malaysian government introduced the Feed in Tariff & Renewable Energy Fund. Under the Feed in Tariff, commercial and residential electricity customers were allowed to generate and sell electricity from RE sources to the national utility companies Tenaga Nasional Berhad (TNB) and Sabah Electricity Sdn Bhd (SESB) at a fixed price and for a specified period. The Renewable Energy Fund that accompanied this scheme was established to finance and accelerate the implementation of the FiT scheme. It received initial funding of MYR 300 million (around USD 87.25 million) from the Malaysian Treasury. A surcharge collected from electricity consumers' bills further funded the scheme. The surcharge only targeted customers using more than 300 kWh per month or paying more than MYR 77 per month. Starting at 1.0%, the surcharge was later increased to 1.6% in January 2014. The Sustainable Energy Development Authority (SEDA) managed and supervised the RE Fund, which financed FiT payment claims and administrative expenses.    Key Enabling Conditions A series of government initiatives, such as the Efficient Management of Electrical Energy Regulations (2008) and the Green Building Index (GBI), accompanied by the promotion of energy-efficient buildings, created a synergistic effect that advanced RE in Malaysia. These efforts, combined with the falling prices of solar panels, significantly enabled the growth of solar energy in particular. Increased awareness among Malaysians about the benefits of solar energy in reducing electricity bills and carbon footprints further contributed to adoption of the FiT scheme and other clean energy initiatives.More recently, in 2023, the National Energy Transition Roadmap (NETR) further increased the ambition of Malaysia in regards to gradually increasing RE shares to, respectively, 31% by 2025, 40% by 2035, and an impressive 70% by 2050. This has acted as yet an additional positive signal and confidence booster for investors in the clean energy space. Impact / Outcomes In the two years following the implementation of the FiT scheme, Malaysia approved a total RE capacity of 482 MW, of which 40.2% was solar photovoltaic, 27.7% was biomass, 27.2% was small hydro, and 4.9% was biogas. This two-year period saw a cumulative total of 119 MW of RE capacity connected to the grid, representing a 94% increase from the 61.2 MW connected at the end of 2010. By November 2013, SEDA had collected MYR 510 million (USD 148 million) from the 1% consumer surcharge, disbursing MYR 66.8 million (USD 19.4 million) for FiT payments and MYR 3.3 million (USD 1 million) for administrative fees. After disbursements and fees, the RE fund had a balance of MYR 752 million (USD 219 million), including the initial grant and earned interest. Though the FiT scheme contributed to significant increases in RE generation capacity, especially solar PV, the Malaysian government replaced the solar FiT scheme in 2016 with the Net Energy Metering (NEM) and the Large Scale Solar (LSS) schemes. The NEM provided consumers with greater incentives to consume RE efficiently and energy prices which better reflected market rates, while the LSS supported the uptake of utility scale solar PV systems through a reverse auction system.Additional SourcesHusain, A. A., Ahmad Phesal, M. H., Kadir, M. Z. A. A., Ungku Amirulddin, U. A., & Junaidi, A. H. (2021). A decade of transitioning Malaysia toward a high-solar PV energy penetration nation. Sustainability, 13(17), 9959, https://doi.org/10.3390/su13179959 Malek, D. B. A. (2013). Briefing on RE Funding Mechanism for the Feed-in Tariff, https://www.st.gov.my/en/contents/highlight/2013/4_SEDA.pdf Parliamentary Research Officer (2013). Feed-In Tariff and Renewable Energy Fund, https://www.parlimen.gov.my/images/webuser/artikel/ro/amy/FiT%20and%20RE%20Fund.pdf Razali, A. H., Abdullah, M. P., Hassan, M. Y., & Hussin, F. (2019). Comparison of new and previous net energy metering (NEM) scheme in Malaysia. ELEKTRIKA-Journal of Electrical Engineering, 18(1), 36-42, https://doi.org/10.11113/elektrika.v18n1.141 SEDA (2021). Malaysia Renewable Energy Roadmap: Pathway Towards Low Carbon Energy System, https://www.seda.gov.my/reportal/wp-content/uploads/2021/12/MyRER_webVer-1.pdf https://www.iea.org/policies/4801-renewable-energy-act-establishing-feed-in-tariff-fit-system https://lib.uniten.edu.my/ulib/index.php/list-cat5/tnb-1/tnb2014/2014-february/5987-rm325-million-boost-for-re-fund/file http://www.pv-magazine.com/2013/12/05/malaysia-increases-surcharge-to-fund-fit-program_100013656/ https://www.thesolarera.com/post/feed-in-tariff-in-malaysia
Malaysia
Direct Lending to Renewable Energy Projects
Challenges to investmentIn 2011, the Government of Vietnam (GoV) outlined its plan for power sector development from 2011 to 2020 in the National Power Development Master Plan VII (PDMP VII), emphasizing the development of renewable energy (RE) for the first time. The PDMP VII set a goal for RE to comprise 4.5% of total power generation capacity by 2020 and 6% by 2030. In 2016, the revision of PDMP VII increased these targets to 7% by 2020 and 10% by 2030, with specific goals for wind power to reach 0.8% by 2020 and 2.1% by 2030. The revised plan also aimed to increase solar power from near-zero to 0.5% by 2020 and 3.3% by 2030. However, international investors' participation in RE projects remained negligible until 2016 due to the lack of a clear regulatory framework and financial incentives, as well as concerns about the creditworthiness of the state-owned Electricity Vietnam (EVN), as the sole buyer of RE.  ApproachTo encourage private RE investment in the 2010s, the GoV initiated several reforms of EVN that opened the electricity market to independent power producers (IPPs). While EVN remained the dominant electricity off-taker and distributor in Vietnam, the reforms allowed power purchasers other than EVN to buy power from all Build-Operate-Transfer (BOT) plants, wind, or geothermal projects. The government also took steps to ensure that IPPs were given greater certainty about offtake and tariffs from RE projects. In June 2011, the Prime Minister issued Decision 37/2011/QD-TTg, the Wind Decision, mandating that EVN purchase all on-grid wind power produced for 20 years from the start of a project’s commercial operation, with an option for extension. The fixed tariff for wind power, set at VND 1,614 ($0.078) per kWh, was significantly higher than the conventional power tariff of $0.048 per kWh in 2015. This tariff also adjusted for the VND/$ exchange rate, protecting developers from currency depreciation. Similarly, on 11 April 2017, the Prime Minister issued Decision No.11/2017/QD-TTg, the Solar Decision. This decision, valid until 30 June 2019, required EVN to purchase all on-grid solar power generated for 20 years based on a standard power purchase agreement (PPA). The electricity price for solar was set at VND 2,086 ($0.094) per kWh, with adjustments based on a VND/$ central exchange rate set by the State Bank of Vietnam on 10 April 2017, excluding VAT.   Key Enabling ConditionsThe Wind Decision and Solar Decision were accompanied by several complementary policies, to establish the RE generation market and promote IPPs. Under the PDMP VII and subsequent revisions, the GoV set a clear roadmap for RE generation and a framework for supporting policy measures including higher tariffs, tax breaks, land incentives, and subsidies for RE research. Finally, Fitch assigned EVN a positive credit rating of BB, highlighting EVN's reliability in PPA payments.Impact / OutcomesOverall, the increased certainty surrounding tariffs allowed the development of a domestic RE ecosystem. From 2011 to 2021, boosted by participation from IPPs, electricity generation from wind increased dramatically from 87 GWh to 3,344 GWh. Similarly, solar power saw remarkable growth, jumping from 22 GWh in 2018 to 27,791 GWh in 2021. Key solar projects initiated during this period gained international recognition, illustrating IPPs’ impact on RE development. For instance, the Loc Ninh Solar Power Plants, consisting of four projects by Thailand’s Super Energy, aimed for a total capacity of 750 MW in Binh Phoc. The CMX Renewable Energy initiative – a joint venture between Sunseap (Singapore), InfraCo Asia (Singapore) and CMX Renewable Energy Canada – completed a 168 MW solar power plant in Ninh Thuan in June 2019, garnering similar headlines. Additional SourcesDang, L. N. and Taghizadeh-Hesary, F. (2019) Avoiding Energy Insecurity by Promoting Private Investment—The Case of the Vietnamese Power Sector. ADBI Working Paper 1038.Tokyo: Asian Development Bank Institute, https://www.adb.org/sites/default/files/publication/539741/adbi-wp1038.pdf ESMAP (2002). Vietnam - Renewable Energy Action Plan, https://www.esmap.org/sites/default/files/esmap-files/vietnamesmap25216.pdf Nguyen, P. A., Abbott, M., & Nguyen, T. L. T. (2019). The development and cost of renewable energy resources in Vietnam. Utilities Policy, 57, 59-66, https://www.viet-studies.net/kinhte/RenewableResources_April19.pdf https://en.evn.com.vn/d6/news/Removing-obstacles-for-IPP-investors-to-develop-power-sources-in-Vietnam-66-163-2020.aspx https://www.energymonitor.ai/finance/vietnam-foreign-investors-in-dire-need-of-incentives-for-renewable-energy/?cf-view https://www.freshfields.com/4ab312/globalassets/what-we-do/markets/asia-pacific/vietnam/our-blogs/investment-in-renewable-energy-in-vietnam-2021.pdfhttps://www.hoganlovells.com/~/media/hogan-lovells--renewable-energy-in-vietnam-jan-2018.pdf https://www.legal500.com/developments/thought-leadership/legal-overview-of-renewable-energy-in-vietnam/ https://www.nortonrosefulbright.com/en/knowledge/publications/71562ac3/renewable-energy-snapshot-vietnam https://policy.asiapacificenergy.org/node/2651https://policy.asiapacificenergy.org/node/3446 https://reglobal.org/vietnams-evn-faces-the-future-time-to-get-renewables-right/https://www.trade.gov/country-commercial-guides/vietnam-power-generation-transmission-and-distribution
Viet Nam
Power Generation opened to Independent Power Producers
DescriptionThe Pay-As-You-Go (PAYG) model is a financial mechanism allowing consumers to pay for services or products incrementally rather than making a single upfront payment. In the energy sector, PAYG is typically implemented using digital payment systems (e.g., mobile), enabling consumers to make a series of modest payments to purchase units of electricity, based on their usage, often on a daily or weekly basis. The service provider can remotely manage and monitor usage, ensuring payment compliance. If a payment is missed, the service can be suspended until the required payment is made. Several PAYG business models exist, some allowing customers to own the equipment after a specific number of payments (i.e., leases).   BenefitsIn the energy sector, the PAYG model is a game-changing credit system that enables low-income consumers to affordably access to energy. By spreading costs over time, it reduces upfront financial barriers to entry. Additionally, PAYG supports the adoption of renewable energy technologies by making them accessible to off-grid and underserved communities, which might otherwise be unable to afford the upfront costs of such systems. This model also fosters innovation by supporting micro-grid and/or community-owned renewable energy projects, helping nations manage investment plans for access to the grid. Case StudySolar Pay-As-You-Go solution in Sub-Saharan AfricaLaunched in 2011, the Azuri PayGo Energy initiative proposed a PAYG service to provide access to clean energy in Sub-Saharan Africa by combining solar and mobile technology. Targeting regions where traditional energy sources like kerosene are costly and polluting, Azuri's Pay-As-You-Go solar home systems provided an affordable alternative. After a small installation fee, users could purchase energy through scratch cards or mobile money, reducing their weekly energy costs by up to 50%. Over 28.5 million hours of clean light and 9.5 million hours of emission-free phone charging were delivered, avoiding 3,504 tonnes of CO2 emissions. Tens of thousands of units were distributed across 11 countries, benefitting hundreds of thousands of people.Azuri's PAYG model not only provided clean energy but also fostered local economic growth. By eliminating high upfront costs, the model enabled customers to own the solar system after 18 months of regular payments. Surveys indicated that typical customers saved up to USD 70 in their first year, with many reinvesting these savings into education, food, water, and business ventures. In 2013, the initiative also created jobs, with locally-employed sales agents, technicians, and customer support operatives. The scalability of Azuri’s model was recognized by a USD 1 million award from USAID to expand operations in Rwanda. With partnerships established, such as with a leading mobile network operator in Tanzania, Azuri aimed to procure an additional 100,000 units over the following two years, further scaling the impact of its innovative PAYG solar solutions across the continent.Additional SourcesPay As You Go Models, Innovation Landscape Brief, IRENA, 2020, https://www.irena.org/-/media/Files/IRENA/Agency/Publication/2020/Jul/IRENA_Pay-as-you-go_models_2020.pdfhttps://unfccc.int/climate-action/momentum-for-change/financing-for-climate-friendly/azuri-paygo-energy
Africa
Pay-As-You-Go

Playbook of Solutions

A World Economic Forum Initiative
About Policy Measures De-risking Tools Finance Mechanisms Case Studies Get Involved
© 2026 All rights reserved
Privacy Policy & Terms of Service