
What is Earth Observation?

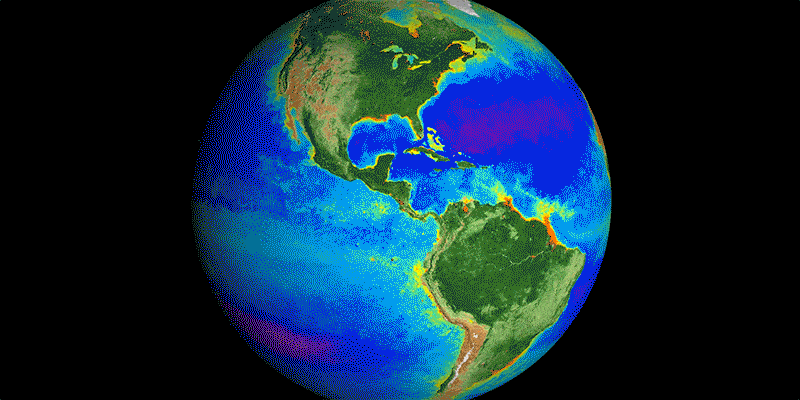
Earth observation (EO) involves collecting data about the planet’s physical, chemical, and biological systems. This information is gathered using a range of sensor technologies - from satellites in space to instruments deployed deep in the ocean, collectively capturing a wide variety of parameters.

GROUND

Mobile phone | Weather station | Camera trap | Acoustic sensor | Light-based spectrometer | ground-based radar (aka LiDAR)
AIR

Rotary drone | High-altitude drones (fixed-wing UAVs) | Crewed aircraft | Stratospheric balloon

SPACE

Low Earth orbit (LEO) satellite | Geostationary orbit (GEO) satellite
The value of EO

By 2030, EO could add $703B to global GDP and decrease CO2 emissions by 2Gt every year. ~94% of the economic potential of EO comes from 6 industries.

Use Case Explorer

Explore the EO Use Case Explorer, an intuitive platform showcasing real-world satellite data use cases. Discover how EO technology tackles critical challenges across industries, with insights on solutions, maturity, cost, and complexity.

Problem StatementAdaptation finance is essential for implementing projects that enhance resilience to climate impacts. However, accessing adaptation finance is challenging due to the need for evidence-based proposals that quantify risks, target finance, justify investments, and demonstrate economic and environmental benefits. As a result, projects often remain in the pipeline as major funds, such as the Global Environment Facility, Green Climate Fund and Adaptation Fund, require data-backed proposals. For projects that have been implemented, measuring successful adaptation during extreme weather events, like flooding, requires real-time data and counterfactual comparisons to accurately assess effectiveness. Traditional methods of data collection, such as field surveys, are often inadequate due to their time-consuming and costly nature. More broadly, many stakeholders lack the data, tools, and expertise to develop compelling proposals, leading to missed funding opportunities.How EO HelpsEarth observation (EO) can bridge this gap by providing the necessary data and insights to strengthen adaptation finance in the following ways:Quantifying Climate Risks: EO technologies provide accurate, scalable data to assess climate risks and prioritize adaptation needs. For example, SAR data from Sentinel-1 maps flood extents and frequency, while Digital Elevation Models (e.g., SRTM, ASTER) identify low-lying, flood-prone areas. In this way, mapping urban flooding can help target finance and justify investments in improved drainage systems. Additionally, vegetation indices like NDVI from Sentinel-2 and soil moisture data from SMAP track drought impacts, supporting applications for water-saving irrigation systems. Lastly, altimetry data from Sentinel-6 monitors sea-level rise, while optical imagery maps erosion hotspots and mangrove degradation, informing coastal protection projects.Building Evidence for Benefits: EO-derived data helps quantify avoided damages. For instance, modeling flood risk reduction using Sentinel-1 data can showcase the economic value of investments in green infrastructure like wetlands or floodplains. Furthermore, historical and predictive climate data, such as ERA5 reanalysis datasets, allow stakeholders to model adaptation scenarios, enhancing project proposals with robust evidence.Tracking Impacts: Adaptation finance mechanisms require transparency in fund allocation and project outcomes. EO supports these needs by enabling digital monitoring, reporting, and verification (dMRV). Using optical imagery, project developers can establish pre-project conditions (baseline) while platforms like Global Forest Watch allow funders to track project outcomes remotely, such as increased vegetation cover after reforestation projects.Economic and Financial ImpactsEnvironmental ImpactsWith EO data providing more accurate environmental risk assessments, investors gain confidence in the long-term viability of investments and reduced financial risk. A study by the European Investment Bank found that EO integration into climate risk assessments can reduce the risk premium for projects by up to 20%, thus lowering the cost of capital.EO provides precise data on deforestation, reforestation, and land-use changes, which helps track emissions reductions and avoid leakage in REDD+ projects. A study by the UN-REDD Programme found that EO tools increased the detection of deforestation by up to 30%, allowing for more timely and effective intervention.By providing independent data on the environmental outcomes, EO helps attract high-quality investments in carbon and eco-credits, increasing transaction volumes. For instance, in the voluntary carbon market, projects using EO data for verification have seen a 12% higher average price per ton of CO2 reduced compared to those relying on ground-based monitoring.Enhancing the monitoring of investments makes it easier to verify that nature-based solutions (NbS) survive and thrive.EO reduces the need for expensive, time-consuming ground surveys by automating environmental monitoring. This is especially beneficial for large-scale projects in remote areas. These savings can be reinvested, improving the financial viability of projects.EO helps assess environmental risks, such as floods, droughts, and wildfires, by analyzing past and current environmental data to predict future events. This is valuable for assessing resilience in investment portfolios.Case Study: EBRD's Green Cities: Satellite Data Drives Sustainable Urban PlanningThe EBRD’s Green Cities Program analysed the long-term environmental impacts of urban infrastructure investments in Sarajevo, Bosnia and Herzegovina. The EBRD Impact department used Earth Observation (EO) data, in partnership with the European Space Agency, to track air quality, vegetation, economic activity, and climate risks like heatwaves and flooding. This data helped them understand local vulnerabilities and make informed urban planning decisions. EO data was also combined with information on elevation, wind speed, and fire risk to identify areas for the best environmental performance gains. The results, presented through an easy-to-use interactive dashboard, showed how seasonal weather patterns affect pollution levels. This analysis contributed to local capacity and the broader economic impact. Overall, the project enhanced the capabilities of local authorities in the Canton and the EBRD’s operational teams by providing stakeholders with EO-based decision-making tools and data management skills for continuous environmental monitoring and planning. It also served as a model for other cities in the EBRD’s Green Cities network, showcasing the benefits of using satellite data to monitor sustainability outcomes and ensure that climate-resilient infrastructure investments achieve their goals.
Financial services, Nature & Natural capital
Accessing Adaptation Finance
European Bank for Reconstruction and Development (EBRD)
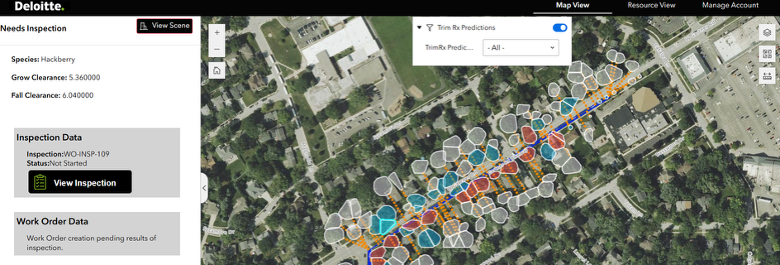
Problem StatementThe maintenance and operational efficiency of large-scale energy infrastructure, such as power lines and solar plants, are critical for ensuring reliable energy distribution and generation. These infrastructures are constantly exposed to environmental hazards like land subsidence, vegetation encroachment, and other natural or anthropogenic changes, which can compromise their structural integrity and functionality. Traditional monitoring methods are often costly, time-consuming, and may not provide timely data to prevent or mitigate risks effectively.How EO HelpsEarth observation (EO) technologies provide a robust framework for monitoring and analyzing the condition of energy infrastructure, such as power lines, across large and remote areas. Unlike traditional ground-based methods, EO enables continuous monitoring and up to date alerts, allowing operators to identify and respond to emerging risks more effectively. By leveraging advanced sensors, high-resolution imagery, and data analytics, EO helps ensures a proactive approach to maintaining network health and mitigating potential disruptions. Vegetation Identification: Light Detection and Ranging (LiDAR) and high-resolution optical imagery, enable large scale mapping and monitoring of vegetation encroachment on critical infrastructure. This capability is particularly valuable for power, where overgrowth can cause service interruptions or damage. Traditional manual vegetation inspection is time-consuming and can miss early warning signs. EO provides actionable insights to prevent interruptions, reduce maintenance costs and enhance operational efficiency.Subsidence Detection: Advanced sensors like Synthetic Aperture Radar (SAR) detect even minor ground movement that could compromise the stability of structures. Traditional subsidence monitoring methods, such as localized ground surveys and borehole measurements, are often insufficient for identifying widespread or subtle subsidence. EO delivers high-resolution, wide-area detection, enabling early warnings and timely interventions to avoid structural damage or service disruptions.Damage Assessment and Recovery Planning: High-resolution imagery and SAR data allow for rapid post-event damage assessments following natural disasters such as storms, floods or earthquakes by providing a comprehensive view of affected infrastructure. This enables operators to prioritize repairs, deploy resources efficiently, and restore services faster all of which minimizes downtime and reduces costs associated with delayed recovery efforts.Economic ImpactsEnvironmental ImpactsContinuous monitoring and vegetation management reduces the need for frequent manual inspections, lowering operational costs by up to 50%.EO aids in the early detection of environmental hazards, such as vegetation encroachment and subsidence, which helps prevent wildfires. Preventing wildfires greatly limits the amount of CO2 released from combustion, with an estimated GHG reduction of 64 million tonnes by 2030. Proactive maintenance strategies ensure quicker responses to infrastructure issues avoiding costly service disruptions. Case Study: AI-Driven Vegetation Management for Utility CircuitsDeloitte's AI-driven vegetation management solution leverages advanced remote sensing data, including classified ortho or stereo Digital Surface Models (DSMs) and LiDAR imagery, to transform labor-intensive utility inspections into a more efficient, cost effective, and scalable process. Today, many power utilities manually inspect all trees near circuits on a cyclical time based process, requiring significant time and resources and prone to human subjectivity error.Using photogrammetry techniques, Deloitte’s solution is designed to generate precise 3D digital models of both vegetation and infrastructure, which are then analyzed by predictive AI algorithms. These digital models and algorithms work together to identify precise vegetation clearances, risk prioritize trim/removal work for the current cycle period and forecast growth all at an individual tree basis to predict future maintenance all of which enable effective & proactive management. Continuous refreshes of remote sensing data provides the foundation for the AI analysis, replacing traditional methods with precise, scalable insights.By integrating remote sensing data and AI models, utilities can automate 30-50% of the trim and removal work identification process and consequently reducing reliance on manual efforts and increase the level of work precision. This can leads to potential benefits such as : 1) operational efficiency and O&M reduction 2) reliability increases from less vegetation caused outages 3) safer communities (wildfire ignition prevention) and 4) optimized field worker time.
Energy & utilities
Network Condition Monitoring
Deloitte
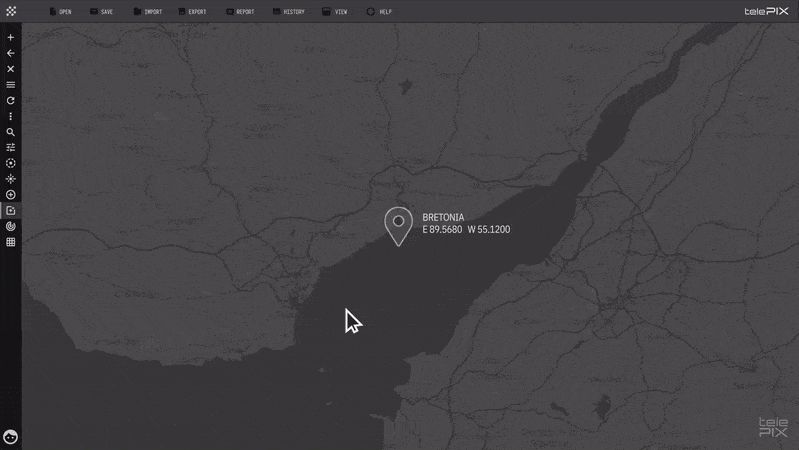
Problem StatementGlobal supply chains depend on accurate, timely information about raw material movement and storage, particularly in less accessible areas. In raw material markets, volume changes are directly correlated with price volatility, making accurate and timely information essential for optimal trading decisions. However, traditional trade data and port statistics are often published on a monthly or quarterly basis, limiting their ability to reflect real-time market changes. Additionally, differences in data accessibility across countries hinder comprehensive global market analysis. This underscores the need for alternative data sources capable of rapidly detecting changes in raw material supply chains, enabling market participants to make more informed decisions.How EO HelpsSatellite-based Earth observation (EO) provides an effective solution for assessment of raw material volumes. Optical and synthetic aperture radar (SAR) satellite data can track changes in raw material types and loading volumes at less accessible ports, warehouses, and logistics hubs with high frequency, providing real-time market insights.Identifying and Classifying Raw Material: EO enables the identification and classification of commodities such as minerals and agricultural products. By constructing a ground spectral library containing the unique spectral signatures of specific minerals and crops, spectral imagery analysis enhances classification accuracy. The integration of artificial intelligence (AI) and deep learning further automates the analysis of vast satellite datasets, efficiently identifying raw material types, distribution and trends.Estimating Volume and Analyzing Trends: EO helps to estimate material volumes by analyzing spatial coverage and pile heights in storage areas. Historical trends can also be analyzed to forecast future demand and supply patterns.Integrating with Supply Chain Data: EO helps to complement other data sources, such as IoT sensors and Automatic Identification System (AIS) data for vessels, creating a comprehensive view of material flows across supply chains.Monitoring Supply Chain Changes: EO technology integrates optical and SAR imagery to provide multi-day, weather-independent, timely monitoring. This enables futures market participants to access accurate data on raw material supply chain changes for rapid data-driven decision-making.Economic ImpactsEnvironmental ImpactsEO helps to increase market transparency, reducing speculative risks and fostering fairer pricing mechanisms.By optimizing logistics and reducing unnecessary transportation, EO helps to reduce associated green house gas emissions. EO helps to enhance supply chain efficiency, enabling better logistics planning by identifying bottlenecks and optimizing material handling, reducing downtime and delays.By supporting better inventory planning, preventing overstocking or spoilage, EO helps to reduce waste.EO helps to reduce operational costs, minimizing reliance on manual inspections and on-site audits, leading to cost savings for logistics and port operators.By tracking raw material stockpiles to mitigate potential hazards, such as runoff from coal or ore storage, EO helps to monitor environmental risks such as contaminating nearby ecosystems.Case Study: Optimizing Scrap Metal Supply Chains with TelePIX's MetalSCOPEThe flow of scrap metal plays a crucial role in global commodity markets, serving as an indicator of industrial activity and economic volatility. TelePIX, a leading South Korean satellite total solutions provider, offers MetalSCOPE, an advanced solution that leverages high-resolution satellite imagery and AI-powered analytics to monitor scrap metal flows. Using deep learning algorithms, MetalSCOPE accurately segments scrap metal in storage yards at ports and estimates stockpile volume. This solution is delivered through a platform with a user-friendly interface, providing market participants with valuable insights into import/export patterns and inventory fluctuations.
Materials, Mining & Metals
Raw Material Market Insights
TelePIX
Problem Statement:Urban areas are experiencing rapid growth, often leading to unplanned development, inadequate infrastructure, and environmental degradation. Planners face challenges in managing land use, monitoring infrastructure expansion, and addressing issues such as urban heat islands, urban droughts, flooding, and air pollution. Urban planning tools rely heavily on outdated or incomplete data, limiting the ability to make timely and informed decisions. Without accurate data on the urban environment, this combination of challenges exacerbates the risk exposure of urban populations.How EO Can Help:Earth observation (EO) technologies offer vital solutions that can transform urban planning practices by providing precise and actionable information to cities:Monitoring Land Use and Urban Growth: EO provides critical insights into land use changes, enabling planners to track urban growth and manage resources effectively. High-resolution optical imagery from Sentinel-2 and Landsat is instrumental in monitoring the spatial expansion of cities, detecting informal settlements, and identifying encroachments on green spaces or agricultural lands. Multi-spectral analysis supports land use classification, distinguishing residential, commercial, industrial, and green areas, which informs zoning decisions and urban development plans. However, differentiating specific land use types in dense urban areas often requires very high-resolution commercial imagery from providers like Planet or Maxar, which increases costs. Integration with cadastral (land ownership) data is also necessary for effective zoning, but such data may be incomplete in many regions, posing additional challenges.Monitoring Environmental Impacts: EO supports environmental monitoring in urban areas, addressing challenges such as air pollution, flooding, and urban heat islands. Thermal imagery from MODIS or Sentinel-3 identifies urban heat islands, helping planners target areas for cooling interventions like tree planting or reflective roofing. High-resolution thermal sensors such as ECOSTRESS provide granular insights into temperature variations at the neighborhood level, even higher-resolution commercial data from providers like Constellr can be used for daily monitoring at individual building level. Flood risks are assessed using SAR data from Sentinel-1, which monitors impervious surface expansion and maps flood-prone areas, even during heavy rain or cloudy conditions. This data, when integrated with Digital Elevation Models (e.g., SRTM or ASTER), enhances flood risk mapping. Air quality monitoring is supported by satellite-derived indices from Sentinel-5P, providing regional-scale data on pollutants like NO2 and SO2, which highlight areas needing targeted interventions. However, thermal data may lack the resolution needed for hyper-local planning, and air quality monitoring often requires integration with ground sensors to ensure accuracy.Optimize Urban Heat Resilience and Cooling Strategies: EO enables planning, monitoring and validating heat resilience measures and thus optimize cooling strategies. The impact of urban green, rainwater harvesting and land cover management for reducing heat islands can be continuously optimized by regularly using land surface temperature (LST) measurements at high spatial and temporal resolution. Using LST from Landsat as a historical baseline, LST from providers like Constellr can be employed to constantly assess the cooling power, health and water availability of urban greens, identify hot spots and cooling potential at hyper local level and thus optimize resource usage for climate resilience measures in any city worldwide.Optimizing Infrastructure Development: EO aids in planning and monitoring urban infrastructure, ensuring efficient resource allocation and compliance with sustainability goals. Optical and radar imagery are used to map roads, railways, and other transport infrastructure, highlighting connectivity gaps. Nighttime lights data from sources like VIIRS provides insights into urban activity patterns, supporting transit-oriented development. EO also supports green infrastructure planning by helping planners identify areas for green spaces, assess tree canopy cover, and monitor vegetation changes using indices like NDVI (Normalized Difference Vegetation Index) from Sentinel-2. High-resolution imagery is instrumental in identifying unauthorized constructions and ensuring compliance with building codes and zoning regulations. However, keeping infrastructure data relevant requires frequent updates, particularly in rapidly growing cities. High-resolution commercial imagery is often required for detailed monitoring, adding to the overall costs of urban infrastructure planning.Economic ImpactsEnvironmental ImpactsSatellite data could replace or augment ground surveys, leading to substantial cost savings in urban projects.Thermal imaging from EO satellites identifies urban heat islands, enabling targeted interventions such as increasing vegetation or modifying building materials. These measures can lead to temperature reductions of up to 2 degrees celsius in affected areas, improving urban livability and reducing energy consumption for air conditioning.Access to accurate, up-to-date EO data enables more efficient infrastructure development. This precision reduces the likelihood of costly planning errors and resource misallocation, optimizing long-term investments for governments and developers.  EO technologies provide data on air and water quality, allowing for the identification of pollution sources and the assessment of mitigation strategies. For example, satellite observations have been used to monitor nitrogen dioxide levels, informing policies that have led to measurable decreases in urban air pollution. Implementing EO-driven urban planning can lead to improved environmental quality and infrastructure, which in turn enhances property values.By detecting unauthorized deforestation or encroachment on protected areas, EO supports conservation efforts and sustainable resource management.Case Study: Leveraging High-Resolution Thermal Data for Climate Resilient Urban DevelopmentIn India, urban sprawl has amplified the effect of climate change when it comes to urban heat. New, climate resilient cooling strategies will need to be established to alleviate the heat issue. Constellr, a global provider of high-resolution thermal data, has been working with Dhun Life, using thermal data to validate their approach to sustainable urban development: Applying only nature-based solutions to change the land cover like planting trees and rainwater harvesting, the area of Dhun was cooled down by 7°C over the span of 9 years compared to an established residential area of nearby Jaipur City. Thus, the development and planning measures in Dhun are more than validated, establishing a blueprint for climate resilient planning.As urban development continuous, regular monitoring using high-resolution thermal data will allow for directly optimizing resource use towards heat management, increasing productivity and reducing health and environmental impacts.
Transportation, Government, Engineering & Construction
Sustainable Urban Planning
constellr, European Space Agency (ESA)
Problem StatementBiodiversity loss is one of the most pressing environmental issues worldwide, driven by habitat destruction, deforestation, climate change, urbanization, and illegal activities such as poaching and logging. The World Economic Forum estimates that failure to halt biodiversity loss could cost the global economy $10 trillion per annum. Conservation efforts often struggle due to limited resources, incomplete data, and insufficient monitoring of critical habitats and biodiversity hotspots. Traditional field-based methods of data collection, while effective in localized contexts, are labor-intensive, expensive, and unable to provide the broad-scale, continuous coverage required for global biodiversity monitoring. Moreover, delays in detecting environmental changes or threats hinder timely conservation interventions, exacerbating biodiversity loss and ecosystem degradation. How EO Can HelpBy leveraging EO data, governments, conservation organizations, and researchers can gain invaluable insights into the state of biodiversity across vast regions, helping to make more informed decisions that support long-term sustainability and ecosystem health.Monitoring Habitat Health: Satellite imagery provides a detailed and cost-effective way to monitor ecosystems across vast and inaccessible regions. Optical sensors like Sentinel-2 and Landsat detect changes in vegetation health, land cover, and habitat fragmentation using indices such as Normalized Difference Vegetation Index (NDVI). Synthetic Aperture Radar (SAR) from Sentinel-1 complements this by mapping structural features such as forest biomass and canopy density, even under clouds or at night. For aquatic ecosystems, satellites including MODIS identify water quality metrics such as turbidity and chlorophyll levels, crucial for monitoring habitats like wetlands, coral reefs, and mangroves.Mapping Species Distributions: EO supports species distribution modeling by supplying key environmental data—such as vegetation type, water availability, and temperature—essential for habitat suitability analysis. For instance, SAR tracks changes in wetland areas, while ocean color sensors like those on Sentinel-3 provide sea surface temperature and chlorophyll concentrations to identify marine biodiversity hotspots.Detecting Environmental Stressors: EO is instrumental in identifying habitat degradation and stresses on those habitats such as  deforestation, wildfires, drought and pollution. Time-series analysis of optical imagery reveals deforestation trends, while thermal sensors detect heat stress in ecosystems, such as coral bleaching or wildfire hotspots. Hyperspectral data can also track algal blooms and oil spills, allowing rapid responses to aquatic ecosystem threats.Monitoring Invasive Species: EO helps monitor the spread of invasive species by identifying their impacts on vegetation and habitat structure. Optical imagery via spectral indices can map invasive plant growth, such as water hyacinths in freshwater systems that can reduce water flow and cause silting, while radar data reveals landscape alterations caused by invasive fauna.Enhancing Conservation Efforts: Satellite data supports conservation by providing continuous monitoring of protected areas, restoration projects, and illegal activities like logging or encroachment. For example, SAR has been used to assess the success of programmes designed to restore mangroves by tracking vegetation regrowth over time. Integrating EO with ground-based surveys and citizen science (participatory) platforms ensures actionable insights for ecologists and decision-makers.Establishing a Price Premium for Ecocredits: Accurate attribution of biodiversity changes to specific actions or events is crucial for effective conservation management. EO facilitates this by providing objective, verifiable data on habitat alterations and species distributions. This capability is foundational for emerging financial instruments such as biodiversity credits, which are designed to help incentivize conservation efforts by quantifying and monetizing positive biodiversity outcomes. These credits allow private entities to invest in conservation projects, with returns linked to measurable ecological benefits. However, the success of such markets hinges on robust monitoring frameworks to ensure transparency and accountability.Economic ImpactsEnvironmental ImpactsEO reduces the need for extensive field surveys, cutting costs while providing broader geographic coverage.Species distribution modeling guides targeted conservation strategies, protecting endangered species and maintaining ecosystem balance.By identifying biodiversity hotspots and monitoring threats, EO supports the prioritization of conservation funding and resource allocation, maximizing impact. Satellites detect poaching and logging in protected areas, reducing biodiversity loss and deterring illegal activity.By monitoring deforestation and land-use change, EO improves the accuracy of eco credits tied to conservation, attracting investment in biodiversity-friendly projects.Consistent monitoring promotes healthy ecosystems, which provide essential services such as pollination, water purification, and climate regulation.Areas with well-preserved biodiversity attract tourists, which can boost local economies. Companies can use biodiversity data to comply with environmental regulations, avoiding fines and sanctions. Case Study: Combining Citizen Science and AI to Restore Surrey's HabitatsThe county of Surrey in the United Kingdom faces a critical biodiversity challenge, with nearly 12% of its native wildlife already lost and many species under threat, particularly due to the decline of semi-natural habitats like heathlands, chalk grasslands, and neutral and acid grasslands. Space4Nature addresses this by integrating ecological surveys from citizen science led by the Surrey Wildlife Trust with advanced remote sensing technologies and machine learning techniques by the Centre for Environment and Sustainability (CES) at the University of Surrey to monitor and map Surrey’s key habitats. High-resolution habitat maps produced by EO technologies support targeted conservation actions, enabling organizations like Buglife to restore over 100 hectares of critical pollinator habitats. The project focuses on Citizen Science volunteers collecting key ecological survey data from 1 m sq quadrants at test sites across Surrey that include Surrey Wildlife Trust nature reserves and open grassland areas at Painshill Park. Since 2022, these surveys, conducted in collaboration with Surrey Wildlife Trust and Buglife, have provided invaluable ground-level insights for calibrating and validating remote sensing approaches. Using high-resolution PlanetScope imagery and machine learning techniques like Random Forest, Space4Nature predicts and maps key habitats with exceptional accuracy. The project also employs supervised classification methods to enhance habitat mapping capabilities, successfully classifying habitats across Surrey County at a 3m resolution using the UK Habitat Classification system. These classifications, cross-referenced with field data and existing habitat inventories, result in a comprehensive and accurate map of the region's biodiversity.This initiative is supported by the players of the  People’s Postcode Lottery and awarded funds from the Postcode Dream Fund and the Garfield Weston Foundation It is being conducted by CES at the University of Surrey in partnership with the Surrey Wildlife Trust, Buglife, and the Painshill Park Trust.
Food & agriculture, Nature & Natural capital
Biodiversity Monitoring
University of Surrey
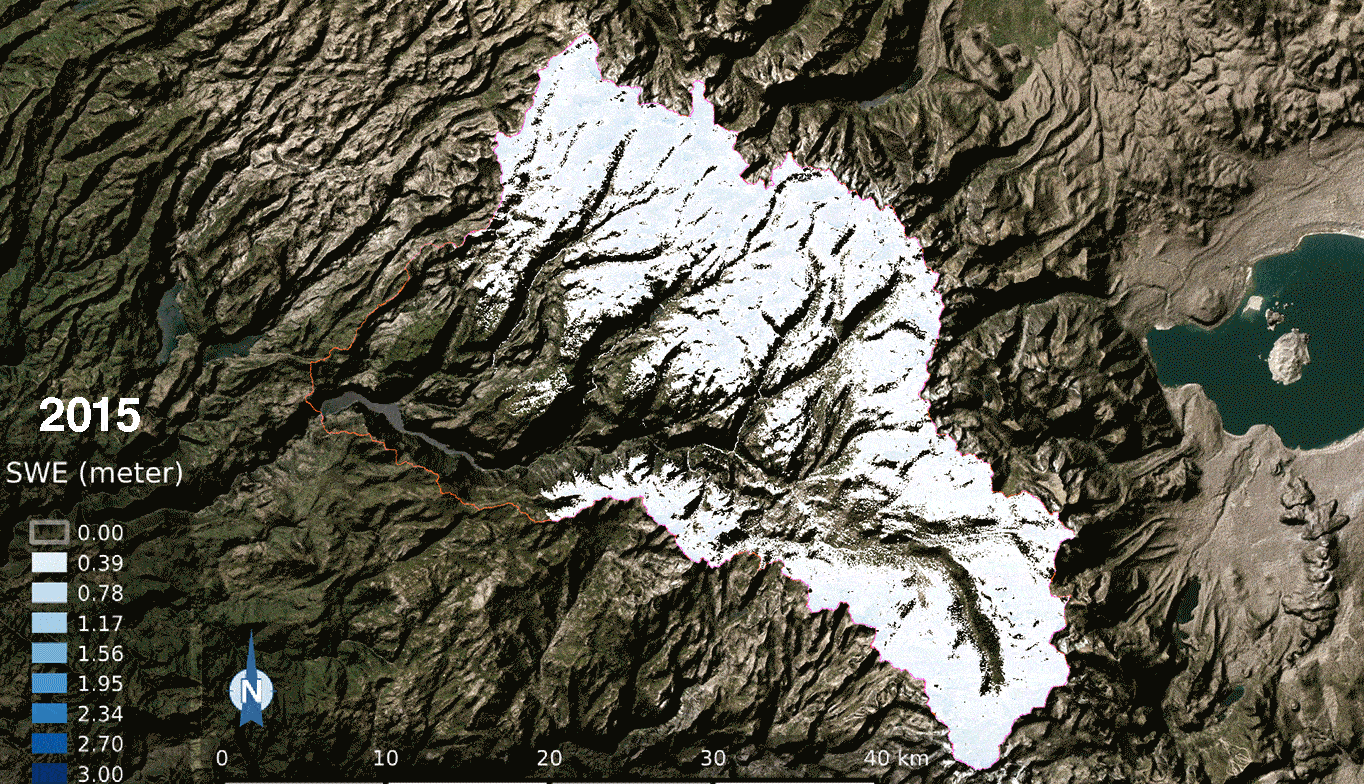
Problem StatementWater availability is a critical concern in many regions, especially those dependent on seasonal snowpacks for a steady water supply. Snowpacks, which store vast amounts of water in frozen form, melt and release water into streams and rivers, sustaining agriculture, hydropower, and ecosystems. However, snowpack levels are increasingly variable due to climate change, leading to concerns over water shortages, unpredictable flow patterns, and hydrological imbalances. Efficiently monitoring snowpacks is essential to forecast water availability, manage resources, and mitigate droughts and flood risks. Traditional monitoring methods involves using a snow probe (a long pole with a weighted end) to measure snow depth or snow cores are sometimes extracted to measure snow water equivalent which measures how much liquid water the snow would release when it melts. These methods only provide spot measurements at specific locations, often far from observation points, and are not effective in monitoring large areas.How EO HelpsEO technologies offer robust tools to monitor snowpack dynamics and predict seasonal water availability. By employing satellite imagery, remote sensing, and advanced data analytics, EO allows for up to date observation and analysis of snow-covered regions. While cloud cover is a common barrier for satellite imagery, advanced techniques have been developed to mitigate this. For example, the Snow Observation from Space Algorithm successfully reduced cloud interference in satellite images over Switzerland by nearly 50%, while maintaining an overall accuracy of more than 95%. These insights empower water resource managers, hydrologists, and policymakers to make informed decisions about water distribution, reservoir management, and flood prevention.Monitoring Snowpack Accumulation and Melt Patterns: EO technologies, through tools like Microwave Radiometer, Synthetic Aperture Radar (SAR), medium to low resolution visible and infrared range wavelength optical imagers, and snow indices such as the Normalized Difference Snow Index (NDSI), enable rough to precise (spatially 1km to 1m, temporally monthly to daily – depending on satellite specification) monitoring of snowpack accumulation, density, and melt patterns. High-resolution satellite imagery reveals changes in snow cover extent and depth, allowing experts to assess when snow begins melting and how quickly it will release water. In regions reliant on snowmelt, such as the western United States and parts of Europe, EO data provides an invaluable indicator of spring and summer water availability, helping to mitigate drought risks and support water allocation.Predicting Streamflow and Reservoir Inflows: EO data can be combined with hydrological models to estimate streamflow and reservoir inflows, providing a forecast of water availability across different seasons. Remote sensing data on snowpack depth and density, when coupled with temperature and precipitation data, allows hydrologists to predict water volumes entering reservoirs, informing water release schedules for agricultural and municipal use. For example, by assessing snowpacks in the Sierra Nevada mountains, EO-driven models can project inflows into California’s reservoirs, aiding in the management of water resources to prevent shortages and optimize water distribution across agriculture and urban needs.Assessing Flood Risks: In regions where, sudden snowmelt can lead to flooding, EO technologies provide early warnings by continuously monitoring snow cover and melt rates. However, the temporal resolution of satellites like Sentinel-1 (approximately 6 days) and Landsat (approximately 16 days) is insufficient to track rapid snowmelt events accurately. Therefore, EO observations must be coupled with in situ monitoring or land surface modeling to allow authorities to predict potential flood events and coordinate timely responses. This combination is not just beneficial, it's necessary.Economic ImpactsEnvironmental ImpactsUsing EO for snowpack monitoring can reduce operational costs by providing accurate water availability forecasts and reducing the need for manual surveys.Early warnings of rapid snowmelt help reduce flood damage by enabling timely, proactive measures. Reliable snowmelt predictions improve water availability forecasts reducing the economic losses from water shortages and enabling stable crop production planning.Predictive water flow management based on snowpack data supports sustainable water use, helping maintain water levels in rivers and lakes that are critical for biodiversity.Case Study: How Colorado Uses Satellites to Secure Water Future Colorado leverages satellite imagery to monitor snowpack by utilizing data from satellites such as the Moderate Resolution Imaging Spectroradiometer (MODIS) on NASA's Terra and Aqua satellites. These satellites provide high-resolution images that help identify snow-covered areas and estimate the extent of snow cover across large regions. MODIS captures data on snow cover, snow albedo (reflectivity), and snow grain size, which are essential for understanding the snowpack's characteristics and behavior. This satellite data is crucial for managing water resources and forecasting water availability, particularly in the Colorado River basin, which supplies water to multiple states.To achieve a comprehensive picture of snowpack conditions, Colorado combines satellite data with ground-based measurements from the Snow Telemetry (SNOTEL) network operated by the Natural Resources Conservation Service (NRCS). SNOTEL stations are equipped with sensors that measure snow depth, snow water equivalent (SWE), temperature, and precipitation, providing real-time data that complement the broader spatial coverage of satellite imagery. By integrating satellite and ground-based data, Colorado can develop more accurate models for water resource management, allowing for better forecasting of water availability, aiding in the allocation of water resources, drought management, and flood risk mitigation. Additionally, the data supports environmental conservation efforts by monitoring snowpack health and its impact on ecosystems.The National Oceanic and Atmospheric Administration (NOAA) significantly contributed to the development of this use case.
Government, Nature & Natural capital
Snow Hydrology
National Oceanic and Atmospheric Administration (NOAA)
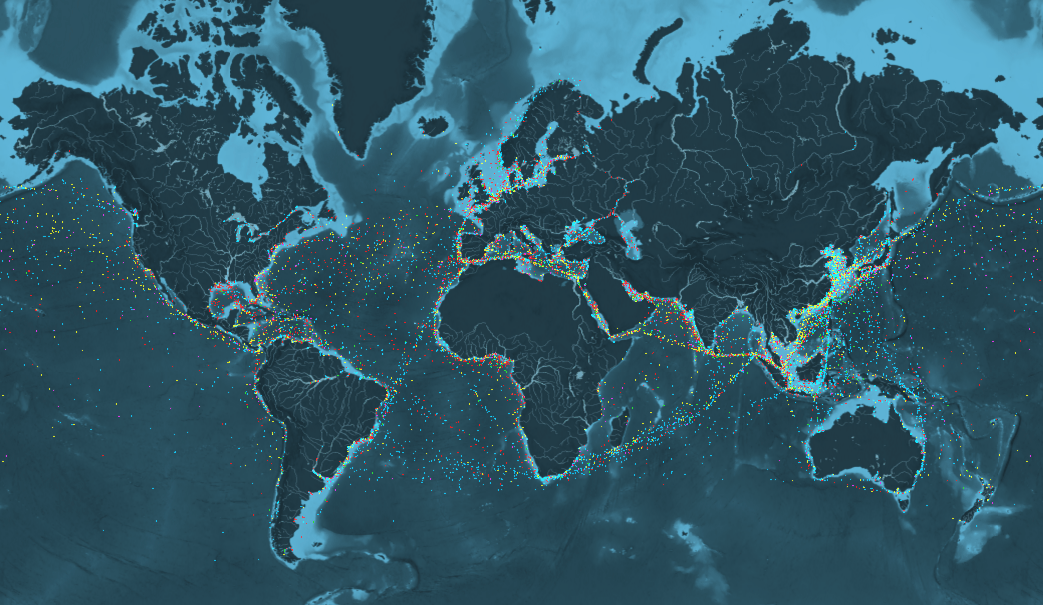
Problem StatementIn the maritime industry, optimizing ship routes to ensure timely deliveries while minimizing fuel consumption and operational costs is a significant challenge. Without accurate and timely information about weather conditions, sea currents, and port congestion, shipping companies often resort to inefficient routing practices. Inefficiencies lead to increased fuel consumption, higher operational costs and contribute to environmental, as the shipping industry contributes nearly 3% of greenhouse gas emissions and marine pollution. Additionally, delays in shipments can disrupt supply chains, leading to financial losses and reduced customer satisfaction.How EO HelpsEarth observation (EO) technologies offer vital solutions that can transform maritime operations by providing actionable information to shipping companies. Unlike traditional methods that rely on periodic reports and manual observations, the use of satellite imagery and enables continuous monitoring of sea conditions. This allows shipping companies to make informed routing decisions quickly, reducing the risk of delays and optimizing fuel consumption.Monitoring Ocean and Weather Conditions: EO data provides vital insights into the constantly changing ocean and weather conditions that impact ship navigation. Satellites like Sentinel-6 and Jason-3, whose data is publicly available, track surface heights, helping to map ocean currents that ships can use to save fuel and avoid rough waters. Wave height data allows ships can take advantage of favorable currents while avoiding rough seas. Monitoring sea surface temperatures (SST) influences fuel efficiency and cargo stability, and timely weather data reanalysis systems provide updates on wind patterns, storms, and precipitation. These tools enable ships to reroute around hazardous weather conditions, ensuring safety and operational continuity.Avoiding Hazards and Risks: EO technologies help shipping operators identify and avoid natural and human-made hazards, reducing risks to cargo and crew. Satellites penetrate cloud cover and provide detailed maps of sea ice extent and thickness, which is critical for optimizing routes in the Arctic and Antarctic regions. EO detects oil spills and algal blooms using optical and radar sensors, ensuring ships avoid areas that may damage hulls or pose environmental risks. Vessel detection algorithms applied to SAR data from Sentinel-1 help identify congested shipping lanes, allowing operators to choose less crowded, safer routes.Optimizing Routes for Efficiency and Sustainability: Integrating EO data with advanced analytics supports the development of fuel-efficient and environmentally friendly shipping routes. Algorithms use EO data inputs, such as ocean currents, wind speed, and wave height, to calculate the most efficient route in real time. This reduces fuel consumption and voyage duration.Economic ImpactsEnvironmental ImpactsShorter and safer routes minimize operational costs, including fuel expenditure and potential delays from weather-related disruptions or hazards. Increased route efficiency means shipping companies can lower fuel consumption by up to 3%, resulting in reduced costs and direct abatement of GHG emissions. This aligns with International Maritime Organization (IMO) regulations targeting a 50% reduction in emissions by 2050.Avoiding delays and hazards further enhances reliability and in turn profitability for shipping operators.Reduced fuel consumption results in lower carbon dioxide (CO2), sulfur oxide (SOx) and nitrogen oxide (NOx) emissions.Case Study: From Satellites to Sea Routes: How EO Keeps Greenland Connected Everything about Greenland is affected by ice. As the largest, non-continental island, communities in Greenland are themselves islands in an inhospitable climate. There are no roads connecting the settlements to each other and all transport is by sea, by air or across the land-fast sea-ice. All goods coming to the island arrive by the sea-bridge provided by the shipping company Royal Arctic Line (RAL). RAL describe themselves as a “piece of infrastructure” and has a sole concession to transport goods to and from the port of Alborg in Denmark to Greenland. Without RAL, life in Greenland would be very basic for its 56,000 inhabitants.RAL ships use the ice-mapping services provided by the Danish Meteorological Institute (DMI) to help navigate through the sea-ice which affects Greenland waters all the year round. The service helps them to avoid waters with high iceberg concentrations and to find the open water through which they can sail more rapidly and more safely. For the last few years, the ice-maps are generated using data coming from the European Copernicus Sentinel satellites.As well as RAL, the ice services help the local fishing companies Royal Greenland and Polar Seafood to operate more effectively and more safely as well as for other vessels sailing in Greenlandic coastal regions ie cruise ships. This enables benefits through cost reduction, better efficiency and better safety. Overall, Greenland is estimated to benefit by between €8.6m and €12.5m each year from the use of Copernicus.
Government, Aviation & Travel, Nature & Natural capital
Ship Route Optimization
Group on Earth Observations (GEO)
Problem StatementEnvironmental events such as hurricanes, earthquakes, floods, and wildfires often leave behind widespread damage to infrastructure, communities, and the environment. Rapid damage assessment is crucial for organizing timely relief efforts, restoring critical services, and protecting affected populations. Post-disaster response methods often rely heavily on ground surveys and human teams, which can be slow, resource-intensive, and difficult to deploy in hazardous conditions. Without timely data, decision-makers may struggle to assess the severity of the situation and prioritize areas of need. This gap in information can delay the allocation of resources during the critical early response phase, hindering the effectiveness of disaster recovery. Moreover, the lack of efficient post-disaster recovery planning can prolong the suffering of affected communities and delay the return to normalcy.How EO HelpsEO technologies are powerful tools for post-disaster response and recovery, offering timely, large-scale insights that are essential for efficient damage assessment, resource allocation, and recovery planning. Satellite imagery, drones, and remote sensing technologies can quickly capture high-resolution imagery from disaster-affected areas, helping responders identify damage hotspots, assess the extent of destruction, and plan relief efforts. These technologies also support long-term recovery by continuously monitoring the progress of rebuilding efforts and the restoration of critical infrastructure.Damage Assessment and Impact Mapping: Satellites equipped with optical and radar sensors can assess damage across large geographic areas, providing timely imagery of affected regions. Post-disaster satellite imagery allows for the identification of damaged infrastructure, including collapsed buildings, flooded areas, destroyed roads, and disrupted utilities. For example, Synthetic Aperture Radar (SAR) can penetrate cloud cover and is particularly useful in disaster scenarios with poor visibility, such as during floods or hurricanes. By comparing pre- and post-disaster imagery, EO technologies enable the creation of precise damage maps. Machine Learning (ML) further enhances this process by automating the comparison of imagery, enabling quicker identification of patterns and anomalies in the data. This automation improves the accuracy and speed of damage assessment, helping to prioritize response efforts more effectively.Rapid and Cost-Effective Response: In disaster scenarios, rapid response is crucial, and traditional ground-based assessments can take days or even weeks. EO technologies provide a timely, cost-effective alternative by offering detailed insights in hours or days. These insights enable emergency responders and governments to deploy resources more effectively, focusing on the area’s most in need of intervention, and ultimately reducing the overall impact of the disaster on affected populations.Reconstruction and Recovery Planning and Monitoring: EO is invaluable for both disaster recovery planning and long-term monitoring. In the planning phase, EO provides pre-disaster baseline data and detailed risk assessments, enabling the identification of vulnerable areas and critical infrastructure requiring prioritization. Post-disaster, time-series satellite imagery supports the tracking of reconstruction progress for housing and infrastructure, revealing changes in the landscape, vegetation, and built environment. Techniques such as change detection analysis quantify recovery pace, while Land Use and Land Cover (LULC) change analysis highlights shifts in land use patterns, signaling the return of human activity and restored functionality. The Normalized Difference Vegetation Index (NDVI) further aids in monitoring environmental recovery through vegetation health and regrowth. Together, these insights ensure informed decision-making in recovery planning and effective monitoring of progress.Economic and Financial ImpactsEnvironmental ImpactsBy identifying damaged infrastructure (roads, bridges, utilities) quickly, EO reduces the overall duration and costs of recovery by preventing misallocation of resources and speeding up the overall recovery processEO technologies help assess environmental damage (e.g., deforestation, soil erosion, contamination) after a disaster, improving the efficiency of ecosystems restoration and protection.Reduction of downtime and disruptions to service of commercial sectors (e.g. transportation, agriculture) .EO technologies can assess the impacts on ecosystems and biodiversity, helping to identify vulnerable species and habitats affected by disaster. This enables the development of restoration plans that not only address immediate damage but also align with long-term sustainability and conservation goals.Quick, accurate damage assessment through EO can expedite insurance claim processing.By identifying and addressing environmental risks early, EO can help prevent large-scale displacement of communities due to secondary environmental hazards.Safely assessing areas that are too dangerous to access via ground surveys, such as zones affected by landslides or collapsed structures can reduce costs associated with deploying specialized personnel, mitigating risks of injury, and expediting the evaluation process.Assessing earthquake damage efficiently with EO reduces heavy machinery use and personnel deployment, thereby reducing energy consumption and greenhouse gas emissions by minimizing on-site visits.Case Study: CEOS and the Haiti Recovery Observatory (RO)In response to the devastation caused by Hurricane Matthew in 2016, the Committee on Earth Observation Satellites (CEOS) established the Haiti Recovery Observatory (RO) to support long-term recovery efforts through satellite data. Led by Haitian organizations including CNIGS, CIAT, and ONEV, the RO aimed to demonstrate the value of EO in post-disaster recovery. It leveraged satellite data to monitor the rebuilding of infrastructure, assess agricultural rehabilitation, and track the restoration of ecosystems such as Macaya Park and coastal mangroves. The RO also provided critical insights for improving disaster preparedness and resilience against future events.This collaboration allowed for the integration of high-resolution imagery with other data sets, enabling timely decision-making and fostering innovation in recovery processes. The Haiti RO has since become a model for leveraging EO data in disaster management, illustrating its potential to guide recovery and enhance resilience in the face of future natural disasters.Case Study: Rapid Earthquake Response with Synspective's SAROn January 1, 2024, a 6.5 magnitude earthquake struck the Noto Peninsula in Ishikawa Prefecture, Japan, causing significant structural damage and displacing numerous residents. The urgent need for damage assessment and coordinated recovery efforts was paramount.Synspective swiftly deployed its SAR satellite, StriX, to capture high-resolution images of the affected region. SAR technology was particularly effective due to its ability to penetrate cloud cover and capture detailed images regardless of weather conditions or daylight. Within three days of the earthquake, Synspective completed a full-area observation of the Noto Peninsula and automatically extracted surface deformation data. This rapid assessment enabled government and relief agencies to analyze changes in the ground surface using archived images and quickly understand the conditions in hazardous areas, facilitating more efficient planning of field investigations and relief operations. Additionally, the SAR data was made publicly available for transparency and broad access to vital information.
Energy & utilities, Transportation, Government, Engineering & Construction
Post-Disaster Response and Recovery
Clay.foundation, CEOS, Synspective
Problem StatementWhen calculating insurance premiums, insurance companies have traditionally relied on historical loss data, which may not accurately reflect current or future risk conditions. Underwriting is usually done at the beginning of the contractual relationship with periodic but limited updates. This reliance can result in premiums misaligned with the actual level of risk and its changes over time. Typically, insurers use generalized risk models based on broad assumptions and regional averages. These models often fail to account for the specific characteristics of individual properties or assets, leading to a uniform treatment of properties within the same region, regardless of factors such as elevation, proximity to natural hazards, or precise location. Traditionally, risk assessment and premium determination have involved manual inspections and on-the-ground surveys, which are labor-intensive and costly. Lastly, in dynamic environments where risks can change rapidly due to factors like climate change, natural disasters, or human activities, there is a growing need for insurers to adjust premiums dynamically in response to changing conditions. Continuous risk assessment is particularly well suited for construction sites, agricultural areas, or public infrastructures given the dynamic nature of building development, crop lifecycles, and the aging of roads and bridges.How EO HelpsEO technology addresses these challenges by providing accurate, up-to-date, and location-specific data that can be used to enhance risk assessments and develop more precise, dynamic insurance premium models. By integrating satellite-derived information on hazards, exposure, and vulnerability, insurers can build dynamic models that reflect real-world risks and the corresponding changes over time. Optical and radar data offer insights into property conditions, vegetation health, and hazard history, while environmental variables like precipitation, temperature, and soil moisture inform predictive models for risk assessment. These technological shifts help insurers better understand and price risks, leading to more sustainable and equitable outcomes for both insurers and policyholders. Insurers can automate parts of the underwriting process by using EO data to quickly assess the risk profile of new policies. This reduces the need for manual inspections and speeds up policy issuance.Assessing Risk and Hazard Exposure: EO enables precise mapping of risks by providing detailed data on environmental conditions and historical hazard events. Optical imagery from satellites like Sentinel-2 and Landsat is used to assess property conditions, crop health, and proximity to hazard-prone areas. Synthetic Aperture Radar (SAR) data, such as that from Sentinel-1, complements optical imagery by detecting ground deformation, flood extents, or damage even under cloud cover. For climate-sensitive risks, EO-derived environmental data—such as precipitation patterns from GPM or temperature anomalies from ERA5—provides a historical baseline for hazard exposure and severity. These datasets feed into models that quantify risk probabilities and assign exposure ratings to insured properties or assets.Predicting Loss: EO supports dynamic modeling of vulnerability by analyzing site-specific characteristics and hazard intensity. In agriculture, indices such as the Normalized Difference Vegetation Index (NDVI) from MODIS or Sentinel-2 monitor crop health and drought impacts, enabling insurers to estimate potential yield losses. For property insurance, high-resolution optical and radar imagery helps identify vulnerabilities such as structural damage, proximity to erosion-prone coastlines, or wildfire risk. EO data also tracks long-term changes in vulnerability, such as the degradation of protective ecosystems like mangroves or wetlands, which can amplify disaster risks. Predictive loss modeling integrates EO data with ground-based information to simulate damage scenarios.Calculating Fair and Dynamic Premiums: The processed EO data can then be integrated into insurance risk models to calculate premiums more accurately and dynamically based on timely and historical risk profiles. In parametric insurance models, EO provides the trigger conditions for payouts, such as rainfall exceeding a predefined threshold or drought indices crossing a critical limit. This approach eliminates the need for costly on-ground assessments and speeds up claims processing. For traditional indemnity-based policies, EO data improves pricing precision by capturing variations in hazard exposure and vulnerability across insured assets. For example, radar and optical imagery combined with climate data can adjust premiums for properties based on their specific flood risk or fire susceptibility. Advanced analytics platforms process these datasets, enabling insurers to offer customized policies that reflect individual risk profiles.Verify Claims: After a natural disaster, EO data can be used to verify claims by comparing pre- and post-event imagery. This helps insurers quickly assess damage and process claims more efficiently, reducing the potential for fraud.Economic ImpactsEnvironmental ImpactsIndex insurance products offer a viable alternative to traditional insurance because they allow insurers to make payments without conducting loss assessment inspections once the insured event occurs. EO providers can rapidly supply data for claim processing within 1 to 5 days, which aligns with insurers’ claims 2-3 week handling cycles.Incentives for landowners to maintain protective ecosystems to qualify for lower premiums due to reduced vulnerability.Automating premiums and claims calculation processes through EO data reduces manual work, thereby enhancing efficiency and customer satisfaction.Premium adjustments can encourage land management practices that mitigate risks, such as maintaining vegetation buffers to reduce fire spread.EO-enabled models lower barriers for insuring underserved regions by quantifying risks in remote or previously uninsurable areas. This expands the insurance market, increasing coverage. Case Study: AXA's EO-Enabled Drought InsuranceAXA, a global insurance leader, partnered with Planet, a provider of Earth Observation data, to create an innovative drought insurance program that uses high-resolution satellite data to monitor soil moisture, vegetation health, and drought intensity in real-time. AXA Climate receives detailed measurements of the volume of water contained in soil at a high resolution to a depth of about 5 centimeters in their areas of interest, which helps determine risk for drought-related losses, such as crop yields. This program offers a proactive insurance model that minimizes risk, provides timely financial relief, and enhances climate resilience for farmers by delivering accurate, localized data to optimize coverage and pricing decisions. The collaboration with Planet enables AXA Climate to dynamically update risk profiles, ensuring insurance policies remain relevant and responsive to environmental changes. This initiative not only strengthens AXA's market position and aligns with environmental sustainability goals but also demonstrates AXA's leadership in leveraging technology to manage climate risks and support broader climate change mitigation efforts.
Food & agriculture
Insurance Premium Calculation
AXA, Planet Labs
Problem StatementThe integrity and operational efficiency of pipelines, which are critical for transporting oil, gas, and other energy sources, is vital for enabling safe and reliable energy distribution. However, pipelines are constantly exposed to environmental hazards such as land subsidence, corrosion, and natural disasters. Pipeline leaks can release harmful materials, increasing greenhouse gas emissions and causing costly financial losses. Traditional monitoring methods, such as manual inspections and localized sensors, are labor-intensive, expensive, and often too slow to prevent or mitigate risks effectively.How EO HelpsEarth observation (EO) technologies provide a more proactive approach to pipeline management. With continuous monitoring, change detection and near real time alerts, EO ensures faster responses and comprehensive oversight, leveraging high-resolution imagery, Synthetic Aperture Radar (SAR), thermal imaging, and LiDAR to deliver actionable insights.Corrosion Detection: High-resolution optical imagery identifies early signs of pipeline corrosion or material degradation, offering efficient, wide-area monitoring that outperforms slow and inconsistent manual inspections.Subsidence Detection: SAR, can detect even slight ground movements over extensive area, which might compromise pipeline stability. These sensors provide early warning of potential subsidence that could lead to structural failures. Unlike localized methods like ground surveys or borehole measurements, EO captures a comprehensive view of terrain changes over time, ensuring no subtle movements are overlooked.Leak Detection: EO utilizing thermal imaging, SAR and hyperspectral sensors can detect pipeline leaks quickly and accurately. These sensors identify anomalies such as temperature changes, soil discoloration, or gas plumes, which may indicate leaks. By detecting these leaks early EO ensures timely intervention, minimizing environmental and financial impacts associated with leaks.Unauthorized Construction Activity Detection: EO technologies enable wide-area surveillance to monitor for unauthorized construction or excavation activities near pipelines. This capability is particularly valuable for areas where ground patrol may be infrequent or impractical. High-resolution imagery and SAR, which can detect natural and human disturbances, help operators quickly identify and mitigate risks, preventing accidental damage to pipelines and enhancing overall safety and compliance.Economic ImpactsEnvironmental ImpactsBy reducing reliance on manual inspections, EO leads to significant cost savings of up to $619 (nominal USD) per kilometer of pipeline per annum. These savings enable more efficient allocations of pipeline budgets.Early leak detection reduces preventable methane emissions from the oil and gas industry by up to 70%, significantly mitigating GHG impacts. Proactive maintenance minimizes downtime and ensures resources are used more effectively, reducing financial risks associated with pipeline failures and environmental damage.EO supports early hazard detection, preventing spills and other environmental impacts. This promotes sustainable resource management and ensures compliance with environmental regulations.Case Study: High-Resolution Methane MonitoringMethaneSAT, LLC, a subsidiary of the Environmental Defense Fund, in collaboration with BAE Systems Space & Mission Systems, is a groundbreaking Earth observation satellite designed to track global methane emissions with high-resolution imagery and a wide field of view. Methane, accounting for 16% of global emissions and 80 times more potent than CO2 over a 20-year period, is a critical target for reducing global warming. The satellite's data, published publicly and free of charge, provides fast, actionable intelligence via platforms like Google Earth Engine, enabling regulators, industry leaders, lawmakers, and the public to take informed actions to curb emissions. The energy sector, responsible for 40% of human-caused methane emissions, stands to benefit significantly, with potential savings of $2 billion annually from reduced leaks. MethaneSAT aims to support a 45% reduction in emissions by 2025 and 70% by 2030, making significant strides in both economic efficiency and climate change mitigation.
Energy & utilities, Oil & Gas
Pipeline Monitoring
Environmental Defense Fund
Problem StatementIn the global trade ecosystem, verifying the origin of goods is crucial for compliance with trade regulations, ensuring product quality, and maintaining consumer trust. Traditional methods of tracing goods often rely on paperwork that can be susceptible to fraud, loss, or errors. This lack of transparency and accountability in the supply chain can lead to significant issues, including the circulation of counterfeit products, violations of trade sanctions, and loss of revenue for genuine manufacturers and suppliers. Companies that have committed to eliminating deforestation in their supply chains are struggling to demonstrate measurable reduction in deforestation due to lack of appropriate and cost-effective forest monitoring systems and reliable imagery.How EO HelpsEO technologies can significantly enhance the traceability and verification of the origin of goods by providing unbiased, timely, and accurate data directly from the source of production. This data is crucial for validating sustainability claims from organizations, ensuring transparency and accountability. EO can help in the following ways:Tracking Land Use for Resource Verification: Satellite imagery provides clear and verifiable evidence of land use at the point of origin, ensuring commodities such as timber, soy, or palm oil are sourced sustainably. Optical imagery from Sentinel-2 and Landsat allows for mapping of land cover changes, such as deforestation, plantation establishment, or crop harvesting. For example, EO data can confirm whether timber is sourced from legally managed forests or if crops are grown in deforestation-free zones. SAR imagery from Sentinel-1 complements optical data by enabling consistent monitoring, even in cloudy or dark conditions, ensuring continuous traceability.Enhancing Supply Chain Transparency: By integrating EO data with geospatial supply chain platforms, organizations can create transparent traceability systems. For example, combining GPS data from transport vehicles with EO imagery allows stakeholders to track the movement of commodities from source to market, ensuring the integrity of supply chains. Platforms such as Global Forest Watch or Google Earth Engine allow stakeholders to monitor regions, providing accessible, actionable insights into supply chain origins. These technologies empower businesses, regulators, and consumers to verify claims about the origin and sustainability of products.Economic ImpactsEnvironmental ImpactsSupply chain transparency increases consumer confidence, allowing products to access premium markets that demand ethical sourcing.EO-backed traceability can significantly contribute to reducing preventable deforestation. For example, in 2004 the Brazilian government adopted an aggressive policy to limit Amazon deforestation rates which included strengthening satellite monitoring systems and, within a few years, large scale deforestation dropped by roughly 50%.Automated EO monitoring reduces the need for costly on-site inspections, lowering logistics and compliance costs.EO helps monitor sustainable, low-carbon practices. Certified supply chains generate less carbon compared to uncertified counterparts due to better land-use practices.Early detection of supply chain risks (e.g., deforestation or environmental violations) prevents delays and legal challenges. Disruptions to raw material availability can cost industries billions globally, particularly in sectors like textiles and electronics.Traceability ensures that sourcing does not encroach on protected ecosystems, avoiding habitat destruction.Case Study: Nestle Palm Oil Transparency DashboardSince 2017, Starling has been helping Nestlé better understand the complex deforestation patterns in palm oil producing areas, including where deforestation occurs, what its key drivers are, and who is involved. Nestlé leverages the Starling satellite monitoring system to engage suppliers and address deforestation risks within its supply chain. Upon receiving alerts, they engage directly with suppliers linked to the mills around the detected alert to verify supply chain connections, assess measures taken to mitigate deforestation risks, and foster collaboration. This engagement, supported by precise data, enables suppliers to verify their no-deforestation commitments and helps Nestlé allocate resources effectively. When necessary, they collaborate with Earthworm Foundation and their suppliers for on-the-ground verification to inform decision-making, including potential suspensions.Additionally, Starling aids in identifying priority locations for forest conservation, engaging smallholders and plantation companies, and collaborating with local governments for integrated land use planning. Using Starling data, Nestlé piloted a forest footprint analysis in Aceh, Indonesia, to assess future deforestation risks and land rights conflicts, with plans to scale up this work for preventive action. Nestlé's approach underscores the importance of technology and partnerships in promoting sustainable sourcing and reducing deforestation within its supply chain.
Food & agriculture, Nature & Natural capital
Proof of Origin
Radiant Earth
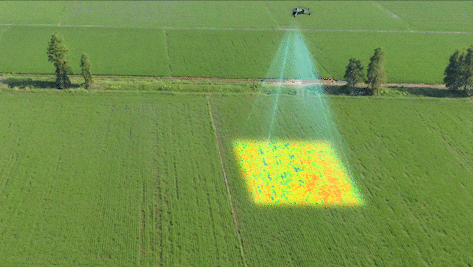
Problem StatementIn the agricultural sector, achieving optimal crop yields while minimizing costs is a challenge every farmer faces. Without accurate and timely information about plant health, water, and soil conditions, farmers often resort to inefficient practices such as over-irrigation and excessive use of fertilizers. These inefficiencies not only lead to reduced crop yields but also increase operational costs while contributing to environmental issues such as water wastage and chemical runoff, which can degrade soil quality and harm aquatic ecosystems. These challenges are increasingly amplified by climate change, conflict, and economic instability and can directly threaten global food security.How EO Can HelpEarth observation (EO) technologies offer an efficient way to optimize crop yield, manage irrigation, and identify pest outbreaks by using a combination of remote sensing tools and data analytics to monitor and manage agricultural fields at scale. One significant application of EO technologies is monitoring crop health, particularly in detecting plant stress and ensuring optimal growth. By using sensors on satellites or drones to capture data in visible, near-infrared (NIR), and short-wave infrared (SWIR) spectra, farmers can identify areas of crop stress caused by nutrient deficiencies, water scarcity, or disease. These insights directly contribute to better crop yield area estimates and more accurate production forecasts, enabling decision-makers to anticipate potential production shortfalls and implement proactive interventions.Manage Nutrients: EO technologies play a crucial role in precision nutrient management, optimizing fertilizer application to enhance crop productivity. Sensors measure spectral signatures related to chlorophyll content and plant health, providing data that, when integrated with soil sampling and on-ground sensors, helps farmers create nutrient management zones. This precise application of fertilizers ensures that crops receive the right amounts of phosphorus (P), potassium (K), and magnesium (Mg), improving nutrient efficiency and reducing waste.Manage Irrigation Efficiently: Efficient irrigation management is another critical area where EO technologies make a significant impact. Thermal sensors detect temperature variations in the crop canopy, indicating water stress levels. Additionally, satellites like NASA’s Soil Moisture Active Passive (SMAP) mission measure soil moisture levels. This can be combined with on-ground soil sensors that measure specific parameters like soil moisture, temperature, pH, and electrical conductivity. These sensors help identify areas where irrigation is needed by detecting cooler (well-irrigated) and warmer (water-stressed) zones.Analyze Soil Texture and Structure: Light Detection and Ranging (LiDAR) can be used to map terrain and analyze soil depth and structure. This can be paired with ground-penetrating radar (GPR) and lidar to analyze soil structure and texture. The reflection of radar waves provides information about clay and silt composition, which helps determine the water-holding capacity of different zones. This data informs the frequency and amount of irrigation needed for different soil types. This information is critical for understanding soil structure, drainage, and how well crops will root and grow in specific zones.Identify Pest Outbreaks: This technology detects subtle changes in plant physiology caused by early pest infestations. Hyperspectral sensors capture hundreds of bands of data, making it possible to detect shifts in chlorophyll content and other plant biochemicals, which may indicate pest activity even before visible symptoms occur. Using machine learning algorithms, organizations can analyze multispectral and hyperspectral data over time to identify anomalies in crop health that might be indicative of pest outbreaks. Early detection enables more targeted pesticide use, minimizing both costs and environmental impact.Through predictive capabilities and early identification of potential issues including production shortfalls, EO technologies not only improve operational efficiency but also facilitate proactive interventions to address emerging agricultural challenges.Economic ImpactsEnvironmental ImpactsIncreases crop yields by up to 2.5% for certain crops through improved pest and disease management and variable rate application (VRA).Reduces water usage by up to 25% and energy usage required for irrigation, further decreasing GHG emissions.Lowers operational expenses by as much as 25% when applying fertilizers and water more efficiently.Facilitates the use of techniques like no-till that minimize soil disruption and can increase soil organic carbon stocks by 8%.Increases farm profitability by up to USD 50 per acre, depending on the crop and region.Enhances soil health (indexed with the selected soil physiochemical and biological properties) by 45%.Improves market transparency, stabilizing food prices and reducing the risk of speculation and volatility.Reduces excess water and chemicals that can runoff into nearby water bodies.Supports efficient allocation of resources for agricultural planning and food aid mobilization through more accurate production estimates.Abates GHG emissions from nitrous oxide (N2O) by 39% which has 273 times the warming potential of CO2 by mass.Case Study: Supporting Food Security During the Ukraine Conflict During the conflict in Ukraine, the Group on Earth Observations Global Agricultural Monitoring Initiative (GEOGLAM) provided timely updates on crop production losses and abandoned croplands, enabling international organizations to plan timely food aid and manage market speculation, ultimately stabilizing food prices and ensuring resource allocation where it was needed most. One significant finding was the abandonment of approximately 7% of Ukraine's cropland due to direct damage from fighting, landmines, and the displacement of farmers, particularly in the eastern and southern regions. Despite these challenges, Ukraine’s wheat production in 2022 reached an estimated 26.6 million tons, higher than initially expected, thanks to effective coordination, resilience, and the use of EO data to support timely interventions. However, the abandonment of cropland and loss of irrigation contributed to a decrease in overall agricultural productivity, reducing production by approximately 5 to 7 million tons compared to pre-war levels.A subsequent major blow came from the collapse of the Kakhovka Dam on June 6, 2023, causing widespread flooding and the loss of critical irrigation infrastructure in southern Ukraine. This event further strained agricultural production by inundating farmland and disrupting water supplies essential for crop cultivation. Throughout these crises, GEOGLAM partners' use of EO data played a pivotal role in monitoring agricultural production, providing accurate assessments that helped mitigate speculation and stabilize global food markets. Additionally, EO technologies enabled the identification of unexploded ordnance in agricultural fields, ensuring safer farming practices and facilitating the planning of timely food aid and recovery efforts in the wake of the dam collapse and widespread displacement. This initiative exemplifies the power of public-private partnerships in leveraging Earth observation for agricultural sustainability and food security.This use case was created with contributions from ClimateAI and Group on Earth Observations.
Food & agriculture, Nature & Natural capital
Cropping
ClimateAi, Group on Earth Observations (GEO)
Problem StatementWildfires, worsened by climate change, causes extensive damage to infrastructure, ecosystems, and communities. In 2023 many regions experienced record-breaking wildfire activity, with a global total of over 55 thousand wildfires which generated approximately 2,170 megatonnes of carbon emissions. Managing these wildfires, and minimizing the damage they cause, is imperative and involves preparation, timely response, and post-event assessment. Monitoring conditions for prescribed burns, detecting and tracking active fires, and assessing damage are all critical for mitigating impact. Traditional damage assessment is often slow and risky, highlighting the need for timely updates on affected structures, land, and vegetation to prioritize response efforts and allocate resources efficiently.How EO Can HelpEarth observation (EO) technologies offer essential tools for wildfire management, supporting land managers, responders, and environmental agencies. Traditionally methods, relying on ground observations and delayed data, limit decision-making speed and accuracy. EO offers more comprehensive and up to date insights through continuous monitoring, large-scale coverage, and precise data on vegetation, weather and fire behavior. Although satellites face some limitations in detecting fires, such as difficulty detecting small or low-intensity fires and cloud cover limiting observation, as satellites continue to advance detection times are becoming much shorter. Currently, for the continental US, active fire data is available within one hour of satellite observation or even within one minute using direct broadcast data and software developed by University of Wisconsin-Madison’s Space Science and Engineering Center.Preparing for Prescribed Burns and Risk Assessment: EO data helps prevent uncontrolled wildfires by identifying areas suitable for controlled burns. Vegetation indices, like the Normalized Difference Vegetation Index (NDVI) from MODIS or Sentinel-2 highlight regions with dry or dense vegetation, while tools like Landsat Thermal Infrared Sensor (TIRS) pinpoints hotspots suitable for fuel reduction. Moreover, EO data provides accurate mapping of areas where controlled burns have been conducted, ensuring compliance and minimizing the risk of overlap with vulnerable ecosystems. By reducing fuel loads strategically, land managers lower wildfire intensity and risk, protecting both communities and ecosystems.Tracking Active Fires for Emergency Response: EO technologies continuously monitor certain areas allowing fires to be detected early on and they provide critical, timely data during wildfires, helping responders track fire spread, intensity, and direction. Satellites detect hotspots, guide firefighting efforts, and monitor smoke plumes for public health alerts. UAVs deliver high-resolution images and thermal data in hard-to-reach areas. This accurate, up-to-date information enables responders to deploy resources effectively, protect lives, and minimize property damage.Assessing Damage and Supporting Ecosystem Recovery: EO data accelerates post-wildfire recovery by quickly mapping damage, erosion risks, and ecosystem recovery. Satellites like Landsat and Sentinel-2 use indices like Burned Area Index (BAI) and the Normalized Burn Ratio (NBR) to quantify burned areas, while vegetation indices like NDVI track regrowth. High-resolution imagery identifies erosion-prone areas, guiding reforestation and soil stabilization efforts, all without requiring hazardous field assessments.Economic ImpactsEnvironmental ImpactsEarly detection of wildfires reduces the area of land affected, potentially saving lives and property.Preventing or extinguishing fires before they spread can greatly limit the amount of CO2 released from combustion, with an estimated GHG reduction of 64 million tonnes by 2030.Access to timely EO data helps emergency responders deploy resources more efficiently, reducing emergency response costs.Accurate monitoring enables targeted firefighting efforts, helping to minimize erosion, maintain soil structure, and preserve water quality. This approach also protects biodiversity and wildlife. For example, during Australia’s 2020 fires, an estimated 3 billion animals were harmed.Mapping burn areas and prioritizing high-risk sites reduces costs associated with post-wildfire restoration projects. Case Study: Enhancing Fire Detection in the Amazon with NASA's New AlgorithmNASA is working to improve the detection of understory fires in the Amazon rainforest, where dense canopy and low-intensity blazes often make detection from space challenging. These fires, while small, can have a devastating impact on the ecosystem, killing up to 50% of trees in affected areas. Dr. Shane Coffield, a researcher at NASA’s Goddard Space Flight Center, has developed a refined fire detection algorithm to address this issue, building on the existing system used by NASA’s Suomi NPP and NOAA-20 satellites. The current system, using the Visible Infrared Imaging Radiometer Suite (VIIRS), is effective for detecting larger fires but struggles with small, hidden fires in the Amazon. These fires, often obscured by the thick tree canopy or smoke, emit minimal thermal radiation, which can lead to underreporting. Coffield’s modification lowers the detection thresholds to capture these smaller, harder-to-see fires, improving detection accuracy in this unique environment. To further enhance detection, Coffield integrates higher-resolution data from Landsat 8, Landsat 9, and Sentinel-2 satellites, which provide more detailed imagery than VIIRS. While these satellites offer 30-meter resolution, they have a lower revisit frequency—available only every two to three days, compared to VIIRS’s twice-daily observations. Coffield is also exploring the use of machine learning to identify warm pixels near known fire hotspots, helping to detect smoldering fires hidden by smoke or trees. This refined detection system is already being applied in the Amazon, providing better tools for forest management and conservation. By leveraging satellite technology and advanced algorithms, NASA is improving fire monitoring in the region, offering valuable insights to mitigate the environmental impacts of these fires.This use case was created with contributions from Chipsafer and the National Aeronautics and Space Administration.
Energy & utilities, Food & agriculture, Government, Nature & Natural capital
Wildfire Monitoring
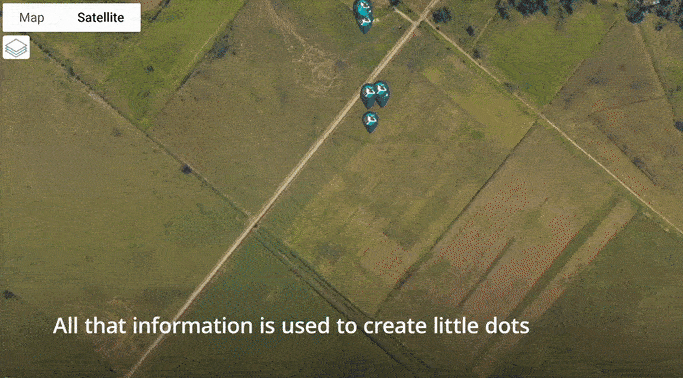
National Aeronautics and Space Administration (NASA), Chipsafer
Problem StatementLivestock farming is a cornerstone of global agriculture, providing essential resources such as meat, dairy, and leather. However, certain livestock management practices can lead to significant environmental challenges, including overgrazing, land degradation, contamination of fresh water sources, and substantial greenhouse gas emissions. These issues contribute to climate change which continues to deteriorate farming conditions by increasing the number of droughts and floods occurring in areas that were not affected previously which makes developing sustainable and efficient livestock management strategies a necessity.How EO Can HelpSatellite-based remote sensing data together with satellite-enabled ground sensors can be used to monitor and manage livestock, aligning agricultural practices with environmental conservation goals more effectively.Tracking Livestock Movement and Monitoring Grazing Patterns: Satellite technologies, especially through indices like the Normalized Difference Vegetation Index (NDVI), and integration with animal GNSS tracking, provide detailed insights into both pasture health and livestock distribution across grazing areas. High-resolution satellite images and remote sensing data allow farmers to monitor vegetation changes and grazing intensity, helping prevent overgrazing, soil erosion, and land degradation. By tracking livestock movements and identifying shifts in grazing patterns, satellite technology enables proactive management to balance grazing pressure across pastures. This approach is particularly valuable in semi-improved natural grasslands. Farmers can optimize grazing rotations and stocking rates based on data-driven assessments of pasture productivity and animal behavior, which enhances ecosystem sustainability while improving operational efficiency.Assessing Environmental Impacts: Satellite technologies facilitate tracking of greenhouse gas emissions from livestock and land-use changes, particularly those linked to the expansion of industrial feedlots and monoculture farming. Satellite data can detect methane emissions levels, a significant concern in feedlot operations, and assess land-use changes as pasture is converted to intensive farming or confined livestock systems. Satellite enables tools can also estimate feedlot capacity, helping to manage animal numbers in these systems while minimizing environmental degradation. In intensive farming regions, such as those transitioning from pasture to large-scale agriculture production, remote sensing helps monitor critical indicators like soil health, waste runoff, and water usage. EO analysis of feedlot density and land-use intensity provides valuable feedback on how farming practices and livestock management impact environmental sustainability, supporting efforts to mitigate negative effects like water contamination, soil erosion and methane release.Weather and Water Resource Monitoring: EO Satellites can monitor both weather conditions and the quality of water sources near livestock farms. By correlating satellite data with weather station data, farms can better plan for seasonal changes, such as droughts or rainfall, and ensure that infrastructure is in place to support water needs. In addition, satellite imagery can track the availability and quality of water sources, detecting potential contamination from livestock waste or other pollutants. This data helps farmers manage water resources more efficiently, ensuring access to clean water for livestock while reducing environmental risks.Economic ImpactsEnvironmental ImpactsImplementing Satellite enabled technologies can lead to reduction in operational costs by optimizing grazing patterns and improving resource allocation.Transitioning from industrial-conventional (IC) management to regenerative-multi-paddock (RM) management enables higher microbial biomass and diversity, and higher fungal: bacterial ratios than IC soilsImproved pasture management through EO-based monitoring can increase livestock productivity. In Central and South America, silvopastoral systems (e.g., high-density trees and improved pastures) led to a 10% increase in milk production.A significant portion of anthropogenic CO2-eq emissions can be removed from the atmosphere and stored in the soil by applying RM management, reducing blue withdrawals and GHG emissions by >50%, relative to IC management.Programs like the Global Environment Facility (GEF) incentivize farmers to adopt sustainable practices, such as silvopastoral systems. Cattle farmers in one program received between USD 2 000 and USD 2 400 per farm (an amount that represents 10 to 15 percent of their net income)Monitoring land-us changes and detecting illegal grazing activities with satellite technology can help prevent deforestation and habitat destruction. By identifying encroachment into protected areas or the conversion of forests to pasture, EO data supports enforcement efforts, ensuring that livestock operation do not contribute to illegal land clearing.Case StudyIn Uruguay, the integration of satellite imagery with the long-established CONEAT Index has enhanced land-use management. The CONEAT Index, which designates specific land areas for certain types of production based on soil suitability, ensures that grassland areas, for example, cannot be converted to forestry. Traditionally based on in-field data, the index is now supported by remote sensing technologies, providing timely updates for more accurate land-use mapping. By combining satellite data with the CONEAT system, Uruguay can monitor land-use changes more efficiently, helping farmers make informed decisions on grazing, crop rotation, and conservation. This approach enhances both agricultural productivity and environmental sustainability, optimizing land management for future generations.This use case was created with contributions from Chipsafer and European Space Agency.
Food & agriculture, Nature & Natural capital
Livestock Management
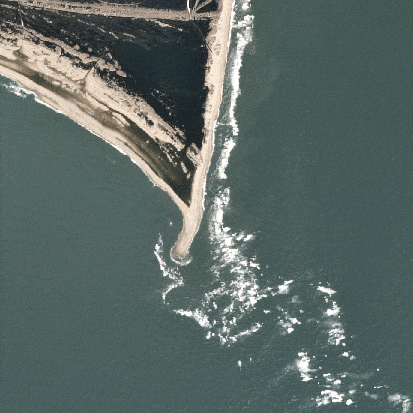
European Space Agency (ESA), Chipsafer
Problem StatementCoastal managers face a complex set of challenges as they balance the demands of environmental conservation, economic development, and community resilience. Rising sea levels and increasing storm intensity due to climate change threaten coastal infrastructure and ecosystems requiring managers to accurately detect and analyze changes. Coastal erosion, habitat loss, and pollution further complicate efforts to maintain the balance between human activity and natural processes. Moreover, the growing pressure from tourism, urbanization, and resource exploitation intensifies the tension between short-term economic gains and long-term sustainability.How EO Can HelpSatellite technologies combined with in situ monitoring which provides the necessary local context, verification, and additional details , provide an efficient and scalable means of monitoring coastal areas, leveraging satellite-based data to deliver actionable insights. Optical and radar imagery are used to track shoreline changes and assess flood-prone areas. Altimetry and bathymetric data enhance understanding of sea-level trends and storm surge risks, while multi-temporal imagery provides insights into long-term erosion patterns. In this sense, EO supports both localized risk assessments and broad-scale monitoring, empowering stakeholders to identify vulnerabilities, prioritize interventions, and adapt to climate-driven changes.Tracking Coastal Dynamics and Erosion: Understanding shoreline movement and erosion patterns is critical for protecting coastal infrastructure and ecosystems. EO enabled technologies offer consistent, detailed monitoring of these changes over time, enabling data-driven decisions. For example, optical imagery is widely used to track shoreline positions and detect movement patterns though it may be obscured by cloud cover and in situ monitoring, such as GPS-based coastal surveys or beach profiling, can fill in gaps and verify satellite-derived data. By analyzing multi-temporal datasets, authorities can detect erosion hotspots and areas of accretion. For regions with persistent cloud cover or nighttime conditions, Synthetic Aperture Radar (SAR) data offers a reliable alternative for uninterrupted monitoring. High-resolution imagery also aids in understanding sediment transport and deposition patterns, essential for studying coastal geomorphology. Additionally, Digital Elevation Models (DEMs) provide valuable insights into topographical changes contributing to erosion risks, though accuracy can be limited in steep or vegetated coastal regions. Satellite overpasses may not frequently enough capture certain dynamic processes, such as tidal effects or diel vertical migrations of harmful algal blooms, necessitating a combination of data sources.Assessing Flood Risks: EO solutions play a vital role in monitoring sea level changes and assessing flood risks associated with storm surges and extreme weather events. Satellite altimetry provides precise measurements of long-term sea level trends. High-resolution bathymetry data complements altimetry, allowing for a better understanding of localized flooding risks and in situ monitoring with tide gauges and local flood sensors provide up to date data that ensures satellite predictions align with actual conditions. By combining altimetry with SAR imagery, EO enables the mapping of inundation areas during extreme environmental events, providing insights for resilience. Optical data is instrumental in delineating flood-affected regions post-event, guiding emergency response and recovery efforts. However, the coarse spatial resolution of altimetry data limits its effectiveness for localized analyses.Monitoring Coastal Habitats: Additionally, EO is invaluable for the conservation and management of coastal habitats such as mangroves, wetlands, and coral reefs. Optical imagery captures the health and spatial extent of vegetation in mangroves and wetlands, supporting habitat monitoring and restoration planning. Multi-spectral imagery further enhances the ability to monitor coral reef conditions, including the detection of bleaching events that indicate ecological stress. Through multi-temporal analysis, EO enables the identification of habitat loss or degradation, guiding targeted conservation actions. SAR complements optical data by providing insights into vegetation structure, offering a detailed view of mangrove forest health and dynamics. Ground based monitoring, such as water quality sampling and direct coral assessments, are also essential for verifying EO data and identifying subtle ecological changes, enhancing conservation and restoration efforts. Despite these capabilities, differentiating between habitat types often requires high-resolution or hyperspectral data, which may be costly or unavailable for some regions.Economic ImpactsEnvironmental ImpactsEarly detection of erosion and flood risks reduces the need for expensive emergency repairs, extending the life expectancy of coastal infrastructure.Detecting changes in vegetation or water quality helps to identify threats like deforestation, overfishing, or coral bleaching. This precise monitoring is vital for promoting biodiversity.Risk maps enable governments to allocate funds efficiently, prioritizing high-risk areas for protective measures like seawalls or mangroves.Mangroves and other coastal ecosystems are highly effective carbon sinks. Monitoring their extent with EO ensures that their capacity to sequester carbon is preserved and expanded. Moreover, by promoting conservation and avoiding habitat destruction, EO helps limit carbon dioxide and methane releases from degraded or deforested areas.Protecting coastal ecosystems sustains industries like fisheries and tourism, contributing ~US $30 billion annually (Chen et al. 2015).EO technologies like multispectral imaging detect sediment plumes, algal blooms, and chemical pollutants in nearshore waters, enabling faster interventions to improve water quality. Cleaner water benefits marine species that rely on clear, oxygen-rich environments, from fish to shellfish to corals.EO reduces the financial losses from storm surges and floods by enabling proactive measures, saving billions in disaster recovery costs.EO reduces disturbances to fragile ecosystems. For example, aerial and satellite imagery eliminates the need for boats or on-foot inspections in sensitive areas. Minimizing human presence prevents unintended impacts on wildlife, such as stress or habitat disruption in breeding or feeding zones.Case Study: NOAA CoastWatch's Satellite-Powered Environmental MonitoringNOAA CoastWatch leverages EO data from satellites to support comprehensive monitoring and management of U.S. coastal and marine environments. By analyzing satellite imagery and data, NOAA tracks key coastal conditions, such as sea surface temperatures, chlorophyll concentrations, and ocean currents, to detect early warning signs of environmental changes. One critical application is monitoring harmful algal blooms, which can have economic and environmental consequences, including fish kills, impacts on public health, and disruptions to local economies dependent on fishing and tourism. Additionally, EO data is used to assess coastal erosion and habitat changes, providing valuable insights for managing these dynamic environments. In fisheries management, NOAA utilizes EO to monitor the distribution and abundance of key fish species, improving the sustainability of these resources. The data aids in the development of more accurate models for managing fish stocks, helping to prevent overfishing and ensure long-term sustainability. By providing timely data, NOAA CoastWatch enhances the ability of stakeholders to respond to environmental threats promptly, ultimately improving coastal resilience and protecting vital resources.Case Study: Combating Sargassum Horneri with EOSargassum horneri is a rapidly spreading brown macroalgae that has caused millions in aquaculture loses and severe disruptions to Korea’s fisheries and tourism since 2015. To combat this growing issue, TelePIX, in partnership with the Korea Institutes of Ocean Science and Technology (KIOST), leveraged Chollian-2B data to develop an advanced detection algorithm for floating algae.Chollian-2B, the world’s first geostationary environmental monitoring and oceanographic satellite, builds on the success of its predecessor, Chollian-1 (COMS), by delivering high-frequency, high resolution data on marine and atmospheric conditions. Equipped with GOCI-II, an advanced ocean monitoring payload, the satellite provides critical insights into marine ecosystem changes, including harmful algal blooms like Sargassum horneri.This led to the development of PiXative, an AI-powered ocean science big data platform that integrates satellite observations from Chollian, Landsat and Sentinel. PiXative tracks and maps marine debris and algae blooms to deliver automated daily analysis reports and near real-time alerts when Sargassum horneri approaches key coastal areas. Beyond mitigating economic and environmental damage, these insights help quantify the role of marine ecosystems in global carbon capture. This bridges the gap between local conservation efforts and global climate strategies. 
Government, Nature & Natural capital
Coastal Monitoring
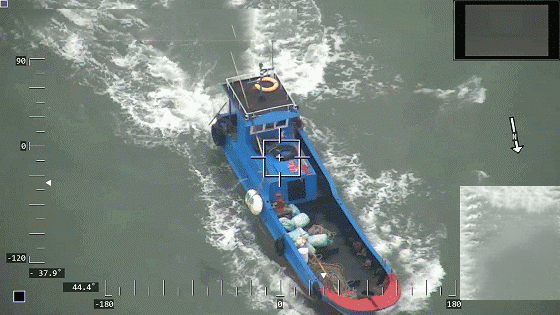
National Oceanic and Atmospheric Administration (NOAA), TelePIX
Problem StatementIllegal, unreported, and unregulated (IUU) fishing undermines global fisheries management, biodiversity conservation, and economic sustainability. Responsible for losses exceeding $23 billion annually, IUU fishing depletes marine resources, destabilizes ecosystems, and disproportionately impacts small-scale fishing communities. Detecting and managing illegal fishing activities is particularly challenging due to the vast areas of ocean to monitor and the ability of illicit operators to evade traditional enforcement mechanisms. A scalable, data-driven approach is necessary to enhance monitoring and enforcement while promoting transparency in maritime activities.How EO Can HelpEO technology offers a powerful tool for combating IUU fishing by providing monitoring and surveillance capabilities. By analyzing satellite imagery, EO can detect and track fishing vessels, identify suspicious activities, and monitor compliance with marine protected areas. This allows for more effective enforcement of fishing regulations and better management of marine resources.Detecting and Monitoring Fishing Activity: Detection of suspicious fishing activity forms the foundation of an effective strategy to combat illicit, unreported, and unregulated (IUU) fishing. EO systems utilize a combination of Synthetic Aperture Radar (SAR) and optical data to identify vessels operating in unauthorized areas or without proper identification. Satellites such as Sentinel-1 and RADARSAT-2 provide all-weather, day-and-night radar imagery, enabling the detection of vessels regardless of lighting or cloud conditions. SAR imagery is particularly effective at locating "dark vessels" that turn off Automated Identification System (AIS) signals or Vessel Monitoring Systems (VMS) to evade detection. Algorithms process SAR data to pinpoint vessel shapes, locations, and movement patterns, that will provide insights around potential IUU activities. High-resolution optical data from Sentinel-2 and Landsat complements SAR by confirming certain behaviour, such as the deployment of fishing gear or course and speed through wake analysis. Visual analysis can help classify vessel types—such as trawlers versus transport ships—to determine whether their activities align with registered permissions. AIS data, and VMS data which tracks legitimate vessels transmitting location and activity information, is integrated with EO systems to cross-check vessel identities. This integration helps identify discrepancies or suspicious behavior, such as vessels turning off AIS transmitters, which is a common tactic used by IUU fishing operators.Classifying and Analyzing Risks: After detecting vessels, EO tools classify activities and assess risks to prioritize enforcement efforts. Machine learning algorithms analyze vessel movement patterns, such as loitering or zigzagging, to identify fishing activities in restricted areas. Historical data from platforms like Global Fishing Watch further aids in identifying patterns and pinpointing IUU fishing hotspots. Combining EO data with geospatial layers, such as MPAs, Exclusive Economic Zones (EEZs), and spawning grounds, creates detailed risk maps that highlight high-priority areas for enforcement. These assessments consider vessel behavior, the frequency of dark operations, and proximity to sensitive ecosystems, enabling authorities to allocate enforcement resources effectively and focus on the most critical areas of concern.Enforcing Laws: EO systems play a vital role in supporting enforcement operations and ensuring long-term compliance with maritime laws. Automated systems provide near-real-time alerts to enforcement agencies, enabling the rapid deployment of patrols or drones to intercept suspicious vessels. Platforms like SkyTruth and Global Fishing Watch integrate EO data to deliver actionable intelligence for enforcement teams, enhancing their ability to respond quickly and effectively. EO also aids post-incident processes by collecting evidence of illegal activities. High-resolution imagery and SAR data document the location, timing, and nature of suspected offenses, serving as critical evidence in legal proceedings. Persistent monitoring capabilities allow authorities to track flagged vessels over time, deterring repeat offenses and encouraging compliance. Public platforms such as Global Fishing Watch make fishing activity data accessible, promoting transparency and fostering accountability across the fishing industry.Economic ImpactsEnvironmental ImpactsIncreases crop yields by up to 2.5% for certain crops through improved pest and disease management and variable rate application (VRA).Reduces water usage by up to 25% and energy usage required for irrigation, further decreasing GHG emissions.Lowers operational expenses by as much as 25% when applying fertilizers and water more efficiently.Facilitates the use of techniques like no-till that minimize soil disruption and can increase soil organic carbon stocks by 8%.Increases farm profitability by up to USD 50 per acre, depending on the crop and region.Enhances soil health (indexed with the selected soil physiochemical and biological properties) by 45%.Improves market transparency, stabilizing food prices and reducing the risk of speculation and volatility.Reduces excess water and chemicals that can runoff into nearby water bodies.Supports efficient allocation of resources for agricultural planning and food aid mobilization through more accurate production estimates.Abates GHG emissions from nitrous oxide (N2O) by 39% which has 273 times the warming potential of CO2 by mass.Case Study: Monitoring Dark Fishing Activity in North Korean WatersIn 2020, Global Fishing Watch conducted an extensive analysis to monitor dark fishing activity in North Korean waters, utilizing the advanced satellite technologies and methodologies outlined in the image below.Over a period of 40 days, spanning the squid fishing season from May to December, the team meticulously gathered and analyzed data. Key components of the analysis included daily observations of nighttime optical imagery and automatic identification system (AIS) vessel tracking data. Nighttime optical imagery was particularly valuable in identifying vessels operating without lights, a common tactic used to evade detection. By cross-referencing this imagery with AIS data, which tracks the movement and identification of vessels, the team was able to pinpoint suspicious activities and potential violations.This use case was created with contributions from Global Fishing Watch.
Government, Nature & Natural capital
Illegal, Unreported and Unregulated Fishing
Global Fishing Watch